Category Archives: Uncategorized

One Way to Play Interest Rate Fluctuations (The Bond Market Lesson-Part III)

IMPORTANT NOTE: In the original version of this article posted on 4/29/2020 Figure 4 – which contains a listing of the hypothetical trades generated by the strategy contained herein – was in error. The table that appears in Figure 4 below has been corrected.

In this article I highlighted the fact that the best predictor of the expected future return for bonds is their current yield. 

In this article I highlighted the fact that interest rates move in long-term trends and that the current roughly 39 year downtrend is getting “a little long in the tooth” and introduced a simple trend-following measure designed to keep you on the right side of the long-term trend in rates. 

Finally, in this article I highlighted the performance for long-term treasuries, short-term treasuries and high yield corporate bonds during rising and falling interest rate environments.

What We Know So Far

*Interest rates have been trending lower for roughly 39 years.  This WILL NOT last forever

*Even if rates do not reverse higher anytime soon, there is only so much more they can fall

*The bond market environment and the mindset that investors have enjoyed for almost 4 decades is still very much in force, HOWEVER, it is almost certain to evaporate in the years ahead (and chances are very few investors are prepared to deal with this change)

*Long-term treasuries are the place to be when interest rates are falling

*Long-term treasuries ARE NOT the place to be when rates are rising

*Short (and intermediate, i.e., 3-7 year) treasuries perform well in a falling rate environment AND can also perform decently over the course of a rising rate environment.  They are also much less volatile than long-term bonds

*High-yield corporate bonds can perform well regardless of the trend in interest rates – as they are much more highly correlated to the stock market and economic trends that impact companies than they are to the long-term treasury yield.  The downside is that they can get hurt badly in a recession

Jay’s TYXRSI Method

What follows is “one way” to attack the bond market.  It is obviously not the “only way” and certainly no claim is being made that it is the “best way” – but it does address the tendency for:

*Bond yields to rise and fall within a larger up or down trend

*The fact that long-term treasuries perform best when rates are falling

*High yield corporates outperform long-term treasuries when rates are rising

Figure 1 displays ticker TYX ($TYX in a lot of charting software), an index that tracks the yield on 30-year treasury bonds (times 100 for some reason.  So, at the end of March 2020 the 30-year treasury yield stood at 1.351%, so TYX was 13.51).

TECHNICAL NOTE: First available data for TYX starts in 1994.  Prior to that time, I use the month-end 30-year yield from another source whose name – in all candor – I can’t quite recall. So good time for the “data obtained from sources believed to be reliable” disclaimer.
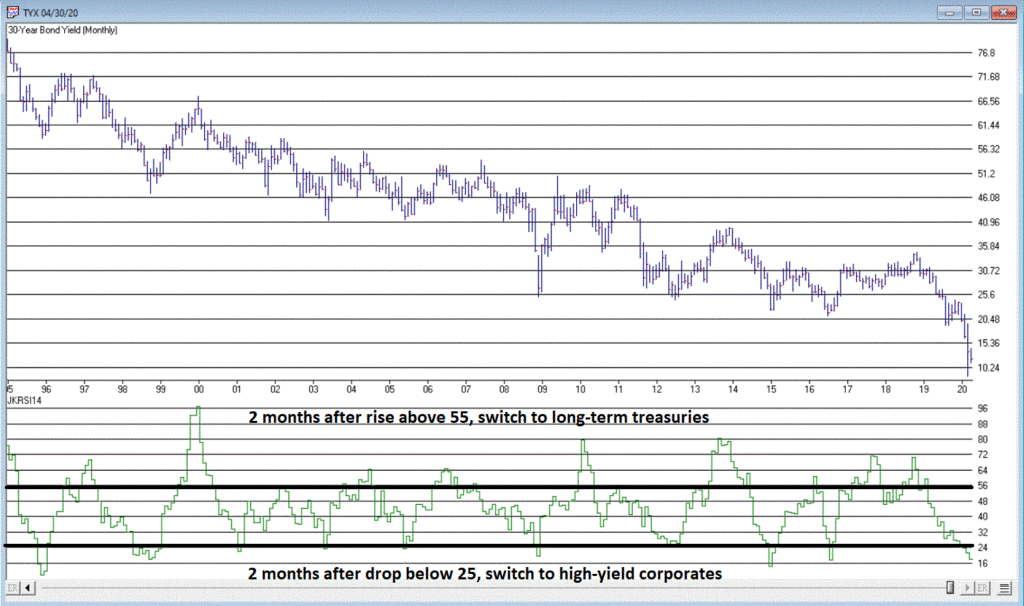
Figure 1 – Ticker TYX: 30-year treasury yield (x10) (Courtesy AIQ TradingExpert)

Below the chart for TYX is an indicator labeled JKRSI14.  It is simply one version of the venerable RSI indicator first introduced by Welles Wilder way back when (calculations are detailed at the end of the article).  Note that as TYX falls so does JKRSI14 and vice versa.  For our purposes we will use 25 and 55 as our cutoffs for “low” and “high”. 

The Trading Rules

*At the end of each month we look at the value for JKRSI14

*If since the end of last month JKRSI14 has dropped from above 25 to 25 or lower, a “sell alert” (for long-term treasuries) occurs

*At the end of the month two months after a sell alert, we sell long-term treasuries and buy high yield corporates

* If since the end of last month JKRSI14 has risen from below 55 to 55 or higher, a “buy alert” (for long-term treasuries) occurs

*At the end of the month two months after a buy alert, we sell high-yield corporates and buy long-term treasuries

And so on and so forth.

Why a 2-month lag between “Alert” and “Trade”? 

Bonds tend not to “turn on a dime”.  Just because treasury yields are “overbought” at the end of a given month, it does not mean that momentum will immediately reverse and favor high-yield corporates.  The 2-month lag gives the current trend a little additional time to “run its course.”

The Data

For testing purposes – and in order to generate as long of a test as possible, we will use the following data for testing purposes:

Long-term treasuries: The Bloomberg Barclays Long Treasury Index from January 1979 through March 2020

High-yield corporates: Vanguard High-Yield Corporate fund (VWEHX) from January 1979 through June 1983, then the Bloomberg Barclays High-Yield Corporate Index after that.

The Results

*Our test starts on 12/31/1978 with long-term treasuries as the favored vehicle, so we will hold the Barclays Long Treasury Index

*The JKRSI14 value for TYX finally dropped below 25 at the end of November 1982.  So, two months later – at the close of January 1983, long-term treasuries would be sold and high-yield corporates would be purchased.

*On December 1983 the JKRSI14 value popped back above 55, so at the end of February 1984 the system switched out of high-yield corporates and back into long-term treasuries. 

*And so on and so forth.

The last two trades were:

*At the end of March 2017, JKRSI14 popped above 55 so at the end of May 2017 the system moved out of high-yield corporates into long-term treasuries

*At the end of January 2020, JKRSI finally dropped back below 25 so at the end of March 2020 the system moved out of long-term treasuries and back into high-yield corporates. 

Comparing TXYRSI Method to Buy-and-Hold

To have a basis of comparison for the strategy, our “benchmark” involves splitting 50/50 between long-term treasuries and high-yield corporates and then rebalancing to 50/50 at the beginning of each year. 

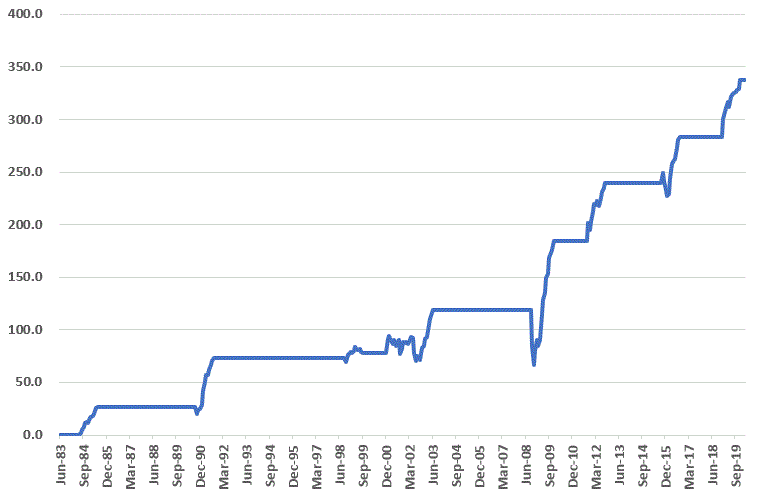
Figure 2 displays the cumulative growth for both the TXYRSI Method and the Buy-and-Hold Approach.
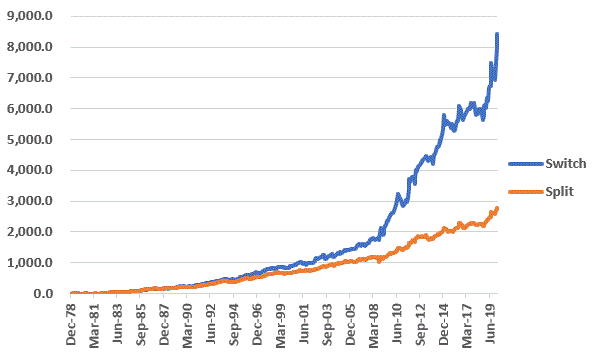
Figure 2 – Cumulative Total Return for TXYRSI Method versus Buy-and-Hold (1978-2020)

Figure 3 displays the comparative performance of the TYXRSI Method versus Buy-and-Hold
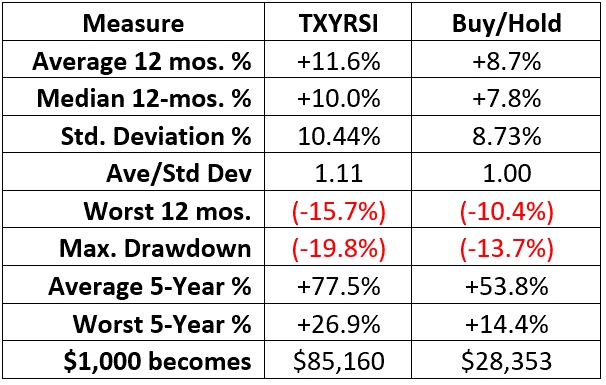
Figure 3 – Comparative Results

Figure 4 shows the individual trade results
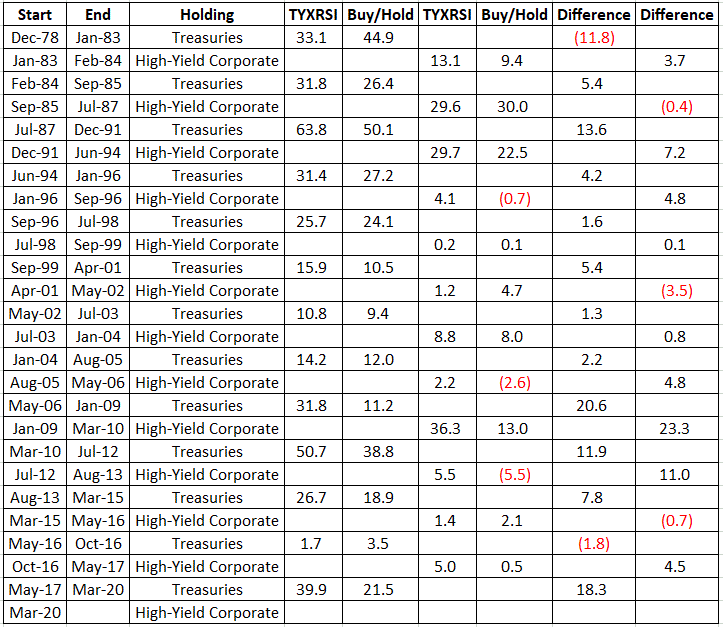
Figure 4 – Hypothetical Trade Results

Summary

The TYXRSI Method makes intuitive sense:

*If 30-year treasury yields get “overbought” it suggests that long-term treasuries are oversold relative to other types of bonds, and that a switch into long-term treasuries makes sense.

*Likewise, if 30-year treasury yields are “oversold” it suggests that long-term treasuries are overbought relative to other type of bonds and a switch into high-yield corporate (which can appreciate regardless of the overall trend in interest rates) make sense.

Will this hold up in the future?  That’s the question.

A Few Additional Notes

#1. I am looking ahead to the day when rates are no longer in a long-term downtrend.  For a number of bond market strategies that I follow I anticipate that when the day comes that TYX trends above it 120-month exponential moving average (see Figure 7 in this article) I will hold intermediate-term (3-7 year) treasuries instead of long-term treasuries when a given strategy calls for treasuries to be held. 

#2. Calculations for JKRSI14:

A = this month’s change in TYX

B = if A > 0 then A else 0

C = if A <= 0 then absolute value of A else 0

D = 14-month total of B

E = 14-month total of C

F = D/(D+E)

JKRSI14 = (F * 100)

Jay Kaeppel

Disclaimer: The information, opinions and ideas expressed herein are for informational and educational purposes only and are based on research conducted and presented solely by the author.  The information presented represents the views of the author only and does not constitute a complete description of any investment service.  In addition, nothing presented herein should be construed as investment advice, as an advertisement or offering of investment advisory services, or as an offer to sell or a solicitation to buy any security.  The data presented herein were obtained from various third-party sources.  While the data is believed to be reliable, no representation is made as to, and no responsibility, warranty or liability is accepted for the accuracy or completeness of such information.  International investments are subject to additional risks such as currency fluctuations, political instability and the potential for illiquid markets.  Past performance is no guarantee of future results.  There is risk of loss in all trading.  Back tested performance does not represent actual performance and should not be interpreted as an indication of such performance.  Also, back tested performance results have certain inherent limitations and differs from actual performance because it is achieved with the benefit of hindsight.
The Bond Market Lesson (Part II)

In this article I highlighted the fact that the best predictor of the expected future return for bonds is their current yield.  In this article I highlighted the fact that:

*Long-term bonds are great when rates are declining

*Long-term bonds are NOT great when rates are rising

*Bond yields have been in a massive downtrend for almost 4 decades

*Bond yields will not stay low forever

Investors who invest in bonds are in a very dangerous place at the moment.  While there is seemingly very little risk of yields rising anytime soon, the reality is:

*Bonds aren’t generating much income at the moment

*Bond prices can appreciate more but only if yields decline more from current levels

*In the years ahead the bond market is unlikely to be the “sure thing” it has been for most of the past 30+ years

*Most investors are unaware of this and/or entirely unprepared to deal a rising interest rate environment

Bond Market Lesson – Part II

For our purposes we will look at bond total return data from 12/31/1978 through March 2020.  During that time 30-year treasury yields rose from 8.8% to 15.2% by September of 1981.  Since then the yield has worked its way lower to 1.35% at the end of March 2020.

We will look at the performance of:

*Bloomberg Barclays Long Treasury Index

*Bloomberg Barclay’s 1-3 Year Treasury Index

*Bloomberg Barclay’s High Yield Corporate Index (the first month of data I have for this index is July 1983.  From January 1979 through June 1983 I used the monthly total return for ticker VWEHX – Vanguard High Yield Corporate fund)

Measuring Performance

We will look at performance in 3 different ways:

*Buy-and-hold

*ONLY during falling interest rate periods

*ONLY during rising interest rate periods

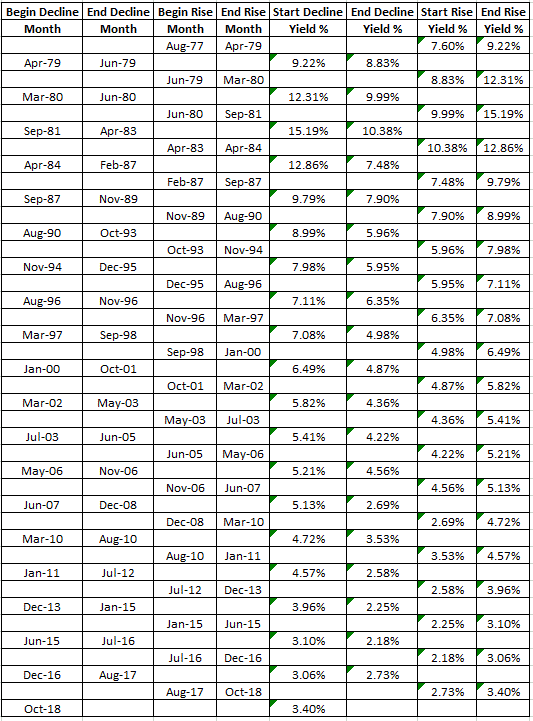
Since this is for illustrative purposes, we identified rising and falling interest rate periods with the benefit of perfect hindsight.  Those periods appear in Figure 1.

Figure 1 – Rising and Falling Interest Rate Periods (1977-2020)

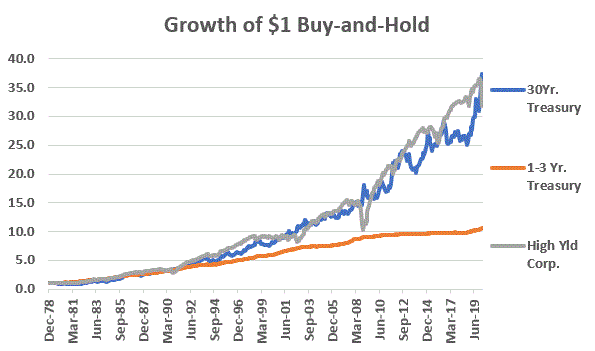
Figure 2 displays the buy-and-hold growth of $1 for all three indexes over 41 years and 2 months.

Figure 2 – Growth of $1 invested on a buy-and-hold basis (1978-2020)

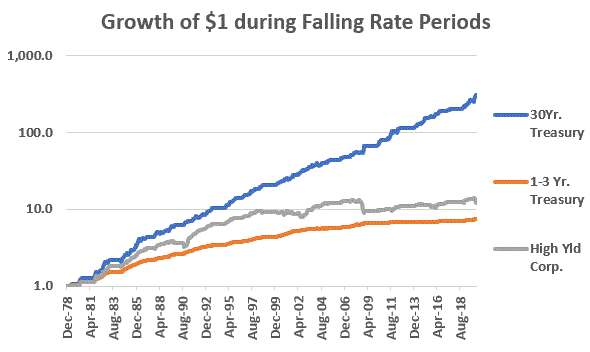
Figure 3 displays growth of $1 ONLY during falling interest rate periods.

Figure 3 – Growth of $1 invested ONLY during rising rate periods (1978-2020)

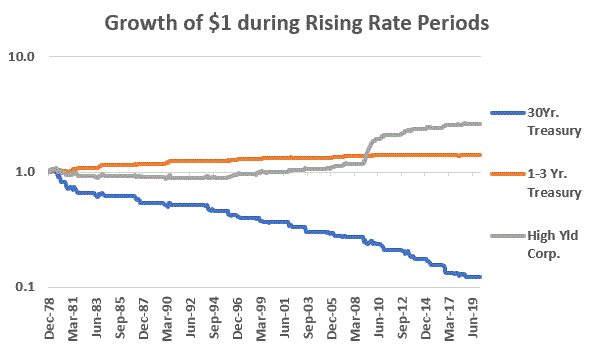
Figure 4 displays growth of $1 ONLY during rising interest rate periods.

Figure 4 – Growth of $1 invested ONLY during falling rate periods (1978-2020)

Figure 5 displays cumulative returns for each type of bond during each of the periods detailed above.

Figure 5 – Bond returns (1978-2020)

The differences are stark and the conclusions are fairly simple:

*Falling interest rates are great for long-term bonds…

*…However, when rates rise, short-term treasuries and high-yield corporates are a much better play than long-term bonds

Summary

It is impossible to know when interest rates will finally bottom out and when a new “rising interest rate environment” will begin.  But it is entirely possible to know what will happen when that day comes – long-term bonds will suffer significantly painful losses.

For a useful guide to how to know when that change is taking place, see Figure 7 in this article.

Stay tuned for Part III

Jay Kaeppel

Disclaimer: The information, opinions and ideas expressed herein are for informational and educational purposes only and are based on research conducted and presented solely by the author.  The information presented represents the views of the author only and does not constitute a complete description of any investment service.  In addition, nothing presented herein should be construed as investment advice, as an advertisement or offering of investment advisory services, or as an offer to sell or a solicitation to buy any security.  The data presented herein were obtained from various third-party sources.  While the data is believed to be reliable, no representation is made as to, and no responsibility, warranty or liability is accepted for the accuracy or completeness of such information.  International investments are subject to additional risks such as currency fluctuations, political instability and the potential for illiquid markets.  Past performance is no guarantee of future results.  There is risk of loss in all trading.  Back tested performance does not represent actual performance and should not be interpreted as an indication of such performance.  Also, back tested performance results have certain inherent limitations and differs from actual performance because it is achieved with the benefit of hindsight.
The Bond Market Lesson That Will One Day Save You from Disaster (Part I)

OK, I typically prefer to attempt the clever title (such as it is) rather than the “bombastic.”  But I have this vision in my head of the bond market somewhere down the road.  And if you have been investing in bonds in any form during any or all of the last 40 years you really should read what follows……because one day everything you think you know about the bond market will be wrong!

(And a bombastic opening paragraph too!  I really need to get out more.  Unfortunately, just like you, I can’t. But I digress.)

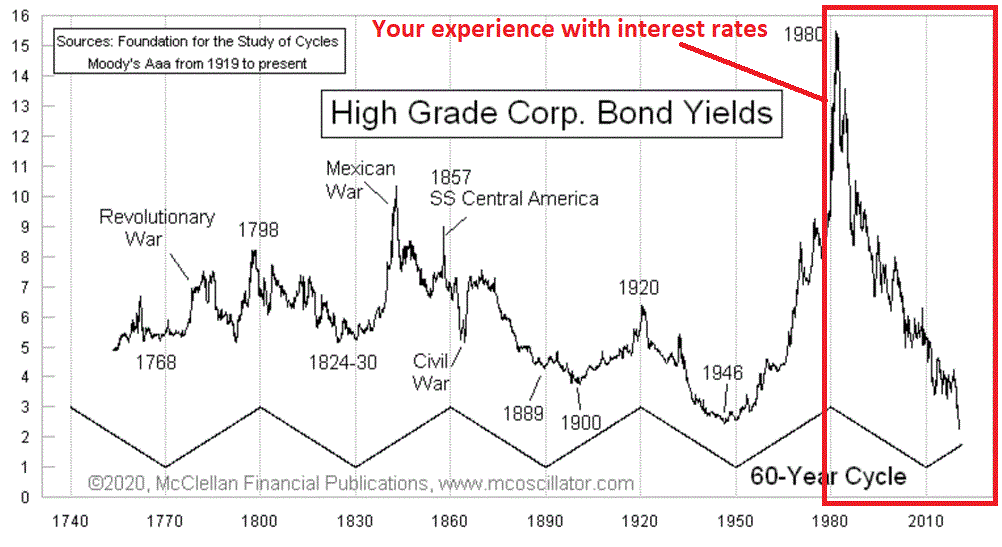
Anyway, first off please note that historically interest rates have tended to move in roughly 60-year cycles – 30 years down, 30 years up.  This is not a “precise, like clockwork” kind of thing, but it has been generally accurate.  Or it least it was. 

Figure 1 was presented by Tom McClellan of www.McClellanOscillator.com.  You can see for yourself the tendency for rates to decline for 30 years and then rise for a similar time.  Not always, not exactly, but as far as “guidelines” go, it’s been very useful.

Figure 1 – History of Bond Yields (Courtesy: www.mcoscillator.com)

Note the red box in Figure 1. If you started investing anytime after roughly 1981, then your entire experience with interest rate – and by extension, the bond market – has been – for lack of a more professional sounding phrase – “Totally AWESOME!!” (Sorry, I’ve been at home with the kids for over a month now).

The Good News:

During the course of your lifetime you have enjoyed arguably the greatest bond market in history. Congratulations.

The Bad News:

Nothing lasts forever – especially in the financial markets.

As you can also see on the far right-hand side of the graph, we are now almost a full decade “overdue” for rates to reverse and move higher.  Which of course seems highly unlikely at the moment.  With the Fed and other Central Banks around the globe pumping money like crazy as a result of the Covid-19 panic, the likelihood of negative interest rates here in the U.S. seems much greater than the likelihood of a rise in rates anytime soon. 

Still, the chart in Figure 1 reminds us that however far away the low in interest rates may be in terms of level and time, rates are unlikely to stay down forever. 

Here’s the Point

Let’s just come right out and say it:

*Interest rates WILL NOT stay low forever

*When they rise, unlike in the past there will be very little yield to offset the decline in bond prices

*When you buy a bond with an extremely low yield you are likely locking in a very low rate of return (to understand why please see this article). 

When you buy a bond with an extremely low yield you are in essence buying a “hoped for trend continuation”.  However, in no way are you buying “value” of any sort.  Buying a bond with a yield of 1% or so (or less) is not unlike buying the S&P 500 when the P/E ratio is over 30.  The trend may continue for a given period of time – but the long-term reward-to-risk profile is NOT positive.

In the meantime, the longer-term prospects (10 years) for bonds are not great.  In this article I highlighted the fact that the best estimator of the future 10-year total return for a bond is it’s current yield.  With yields presently as low as they are:

*Price appreciation will be hard to come by

*Interest paid is minimal

Not a particularly appetizing combination.

Drilling Down on Long-Term Treasuries

The purest play on interest rates are long-term treasury bonds.  When rates fall, long-term treasuries rise and vice versa.  Many investors recognize this fact, but few understand the sheer magnitude of impact that interest rates have on long-term bond price movements.  So let’s spell it out.

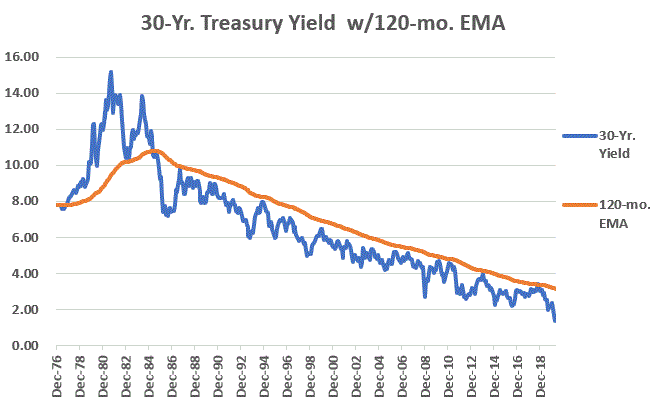
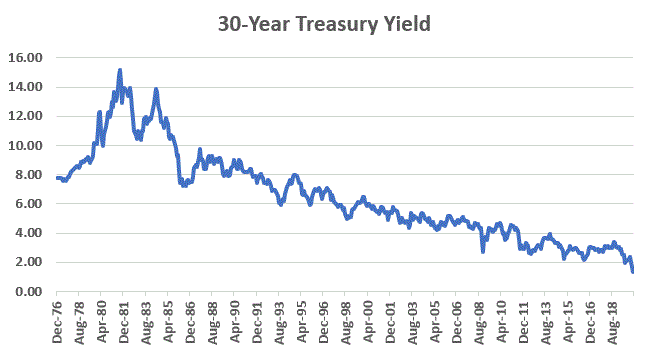
Figure 2 displays 30-year treasury yields since December 1976. 

Figure 2 – 30-yr treasury yields; 1976-2020

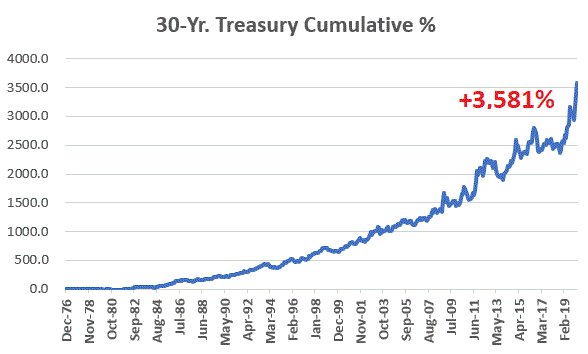
For testing purposes (and in order to test the longest period possible), we will use monthly total return index data for the Bloomberg Barclays’s Long Treasury Index to measure gains and losses for long-term treasuries.

Figure 3 displays the cumulative total return for long-term treasuries during the same period.  Pretty great, right!?

Figure 3 – Long-term treasury cumulative return 1976-2020 (source: Bloomberg Barclays Long Treasury Index monthly total return data)

But there is an important thing to note:

*The ONLY reason Figure 3 slopes upward to the right is because Figure 2 slopes downward to the right.  Nothing more, nothing less.

*If (when) Figure 2 starts “sloping up”, Figure 3 will start to look a lot different.

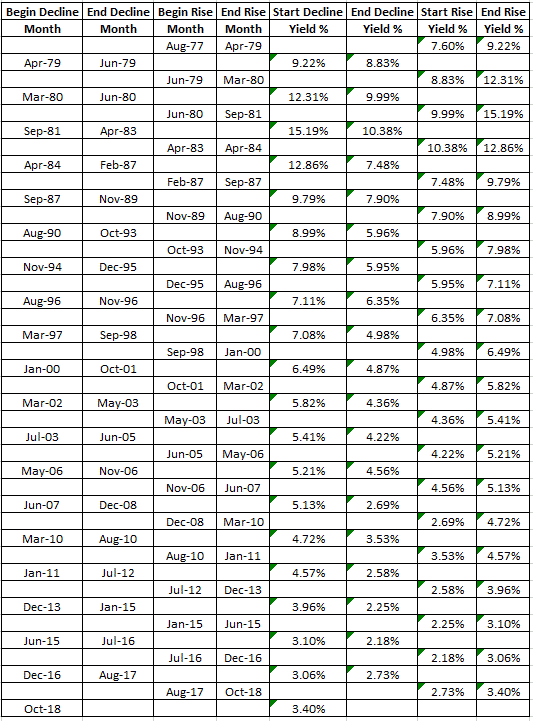
The proof: With the benefit of perfect hindsight, Figure 4 breaks the past 44 years into shorter “falling rate periods” and “rising rate periods”. 

Figure 4 – Rising and Falling Rate Periods; 1977-2020

Now let’s take a (hopefully) clarifying look at the effect of interest rate movements on long-term treasuries. 

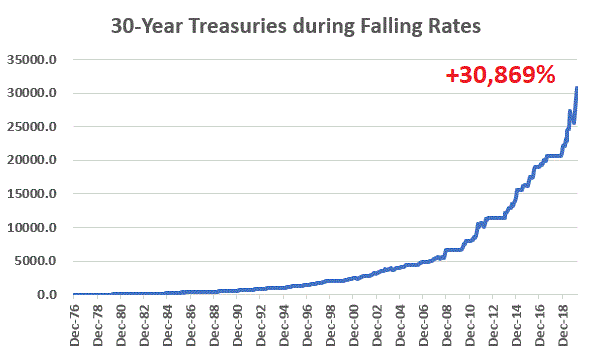
*Figure 5 displays the cumulative return for long-term treasuries ONLY during the “falling rate periods” in Figure 4

Figure 5 – Cumulative returns for long-term treasuries ONLY during “falling rate periods”

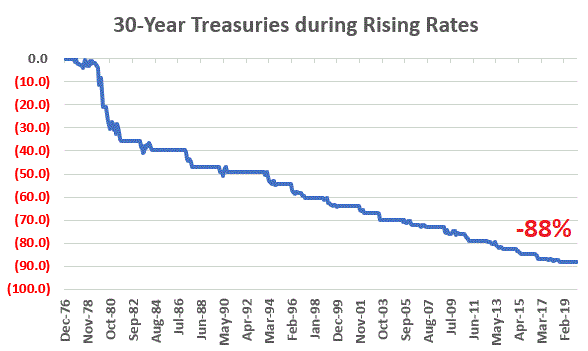
*Figure 6 displays the cumulative return for long-term treasuries ONLY during the “rising rate periods” in Figure 4

Figure 6 – Cumulative returns for long-term treasuries ONLY during “rising rate periods”

Notice a difference?  Just to be sure, note the cumulative return during:

*Rising rate periods = +30,869%

*Falling rate periods = -88%

Any questions on the effect of changes in interest rates on long-term bonds?

Spelling It Out

Just to be clear, in the past 30+ years interest rates have spent a lot more time declining than they have rising.  When the long-term rate cycle eventually changes to a long-term rising rate environment, then rates will spend more time rising than falling. 

Figures 5 and 6 tell us that this WILL NOT be a good thing for holders of long-term bonds.

What You Need to Know: The Short Answer

Timing every up and down in rates is not possible.  But fortunately, because the big long-term swings tend to be measured in decades, we can typically ride the primary trend most of the time (FYI, you’ve been riding one for the past roughly 39 years).

Figure 7 displays the same chart as the one contained in Figure 2 but with a 120-month exponential moving average (more on how to calculate this later) overlaid. 

Figure 7 – 30-year treasury yields with 120-month exponential moving average

So here is what you need to remember (as succinctly as possible):

If 30-year yields are above their 120-month exponential moving average:

*DO NOT HOLD 30-YEAR BONDS!!

*Hold short to intermediate bonds or cash

At the end of March 2020 ticker TYX was at 1.35% and the 120-month EMA was at 3.15%, so this is obviously not something you need to worry about anytime soon. In fact, with the Fed working 24/7 to push interest rates lower, it will likely be quite some time before this signal occurs again. 

But the day will come. And when it does, the impact on your investments and investment strategies will be profound.

I myself use and follow strategies that incorporate long-term treasuries – and boy do the results look great for the past 30+ years! But we (myself included) are kidding ourselves if we believe that the next 30+ years will look anything like the last 30+ years. Which I am pretty sure means it’s time to invoke….

Jay’s Trading Maxim #12: Murphy’s Corollary states the following: Murphy hates you. Plan accordingly.

Stay tuned for Part II

TECHNICAL NOTE: How to calculate a 120-month exponential moving average for ticker TYX (30-year treasury yield).

You can get this value for TYX at (among other places) www.StockCharts.com by entering $TYX as the Symbol.

A = # of periods (in this case we are using 120)

B = 1-C  >>>>>>(.9835)

C = 2 / (A+1) >>>>>(0.0165)

D = Last month’s EMA * B

E = This month’s month-end value for TYX (divided by 100) * C

The 120-month EMA = D + E

So:

The 120-month EMA at the end of March 2020 was 3.15, so:

D = 3.15 * 0.9835

E = April close for TYX * 0.0165

120-EMA at end of April = D + E

Like I said, it won’t do much for you anytime soon. But one day…

Jay Kaeppel

Disclaimer: The information, opinions and ideas expressed herein are for informational and educational purposes only and are based on research conducted and presented solely by the author.  The information presented represents the views of the author only and does not constitute a complete description of any investment service.  In addition, nothing presented herein should be construed as investment advice, as an advertisement or offering of investment advisory services, or as an offer to sell or a solicitation to buy any security.  The data presented herein were obtained from various third-party sources.  While the data is believed to be reliable, no representation is made as to, and no responsibility, warranty or liability is accepted for the accuracy or completeness of such information.  International investments are subject to additional risks such as currency fluctuations, political instability and the potential for illiquid markets.  Past performance is no guarantee of future results.  There is risk of loss in all trading.  Back tested performance does not represent actual performance and should not be interpreted as an indication of such performance.  Also, back tested performance results have certain inherent limitations and differs from actual performance because it is achieved with the benefit of hindsight.
Buy Biotech or Bye Biotech?

The biotech industry is the focus of a lot of attention these days.  All eyes are on myriad companies as they race to find something with which to combat Covid-19.  The “conventional wisdom” is that buying interest will continue to be strong for these stocks as the company that comes up with a breakthrough will, a) make a ton of money, and b) propel the overall industry to sharply higher new highs.

And maybe the conventional wisdom will prove correct.  But just for the record, it’s got a nasty history of “Not”.  This opens the door for any extremely contrarian speculation.

The State of Things Biotech

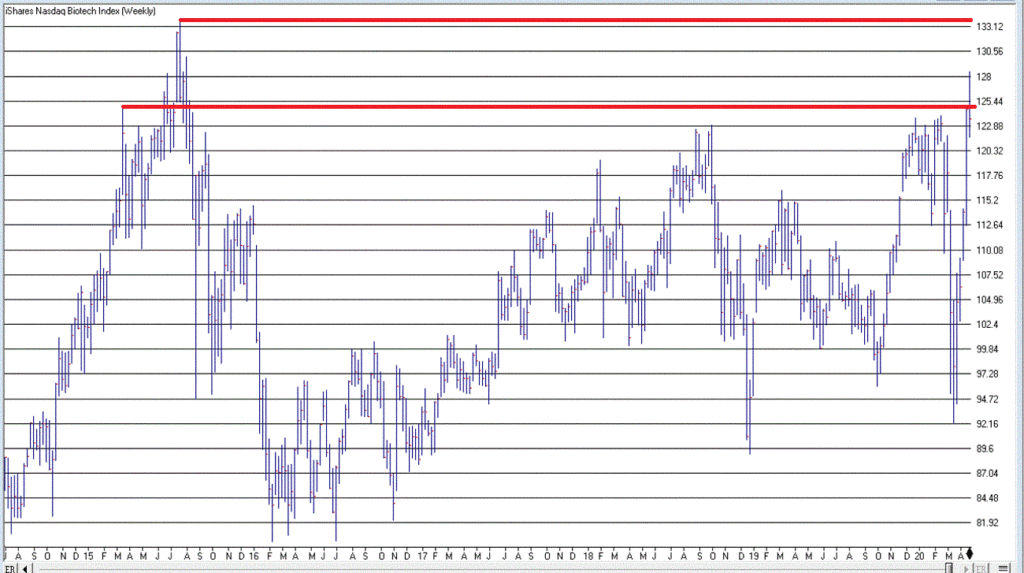
Figure 1 displays a weekly chart for ticker IBB – an ETF that tracks a basket of biotech stocks.  Note that price has, a) had a sharp 33% runup since March, b) has run into some significant overhead resistance.

Figure 1 – Ticker IBB (Courtesy AIQ TradingExpert)

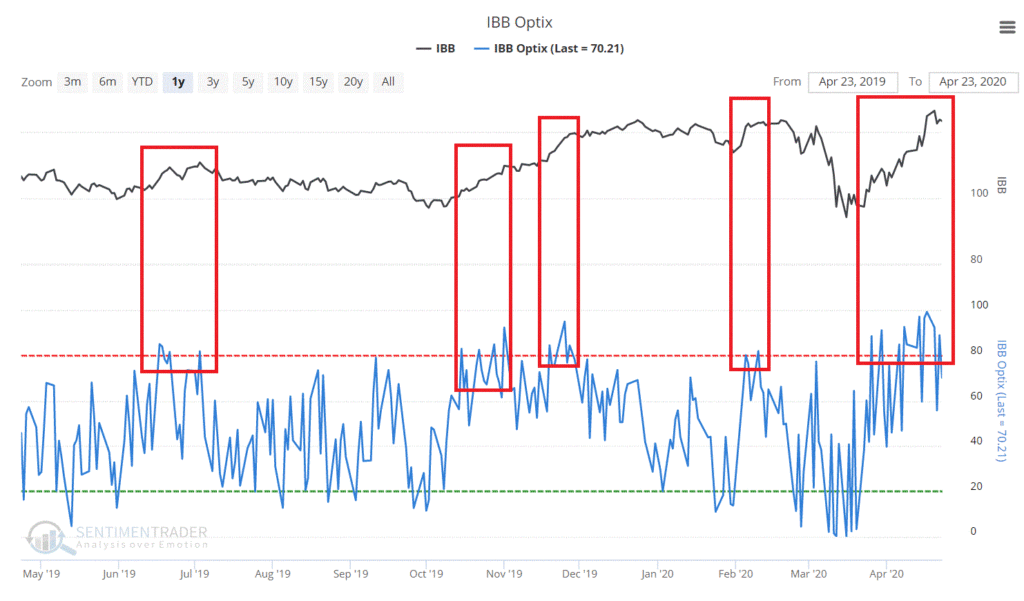
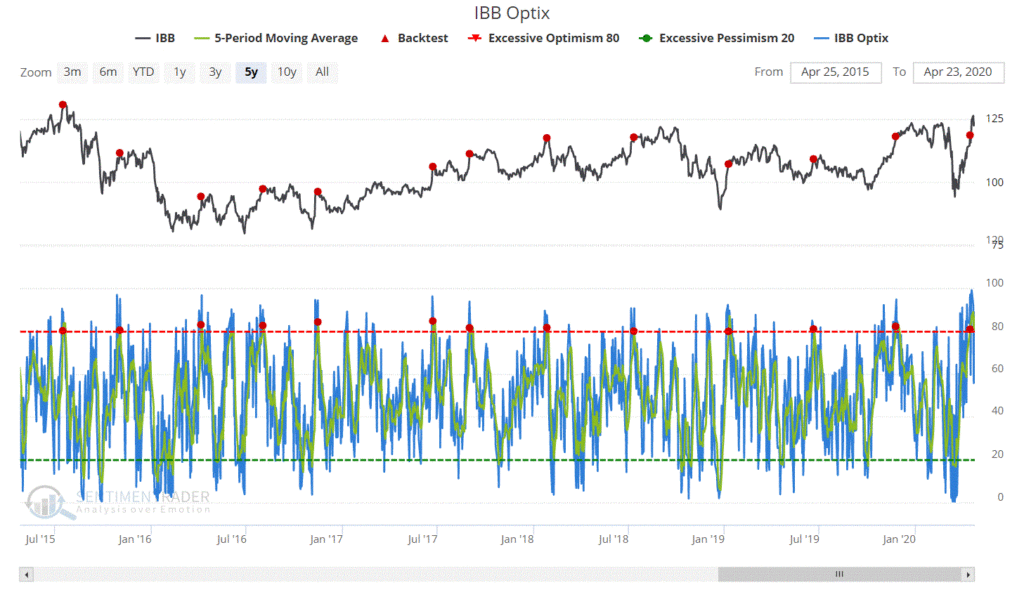
Now let’s turn our attention to www.Sentimentrader.com.  Figure 2 displays ticker IBB with trader sentiment.  Note that trader sentiment (referred to as “Optix”) is presently on the extreme high end of the range.

Figure 2 – Ticker IBB with trader sentiment (Courtesy Sentimentrader.com)

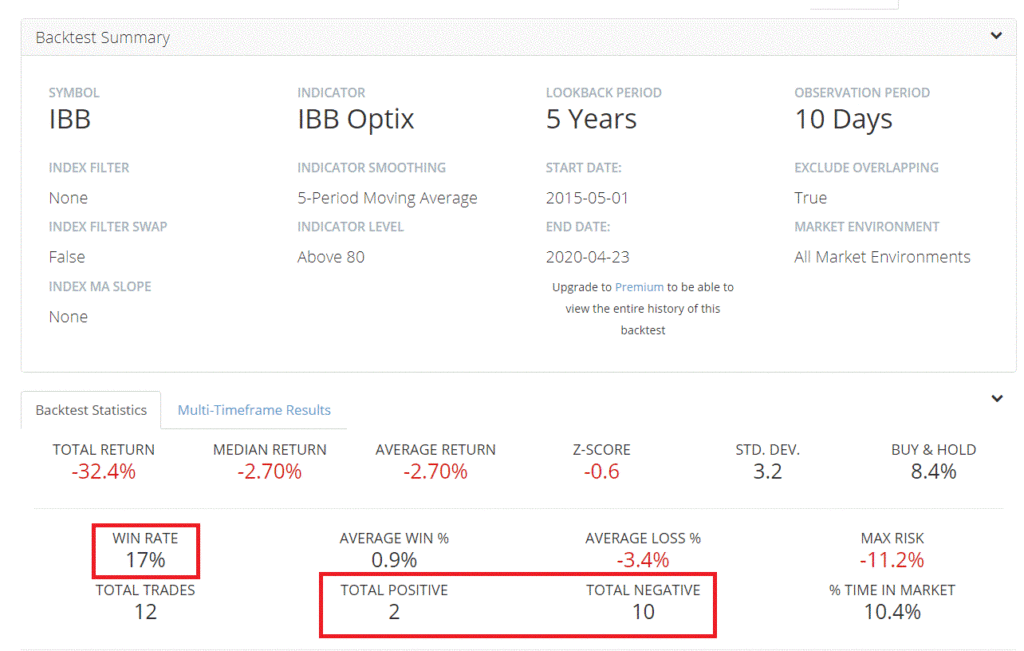
Now let’s see how IBB has performed when the 5-day average of IBB Optix crosses above 80%.  As you can see in Figure 3, in the past 5 years there have been 12 times that this has happened.  Subsequent results were not favorable.

Figure 3 – IBB performance after 5-day average of Sentimentrader IBB Optix crosses above 80% (Courtesy Sentimentrader.com)

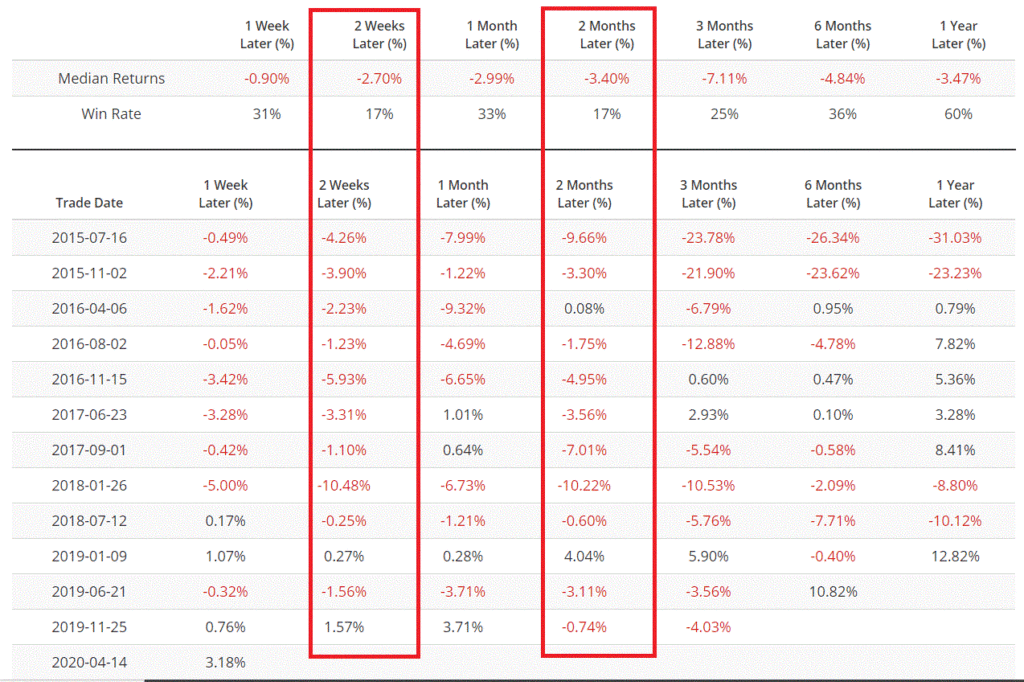
Figure 4 displays the previous instances.

Figure 4 – IBB performance after 5-day average of Sentimentrader IBB Optix crosses above 80% (Courtesy Sentimentrader.com)

In Figure 5 we see that IBB showed a gain 2-weeks and/or 2-months later only 17% of the time.

Figure 5 – IBB performance after 5-day average of Sentimentrader IBB Optix crosses above 80% (Courtesy Sentimentrader.com)

Does this mean that IBB is doomed to trade lower from here?  Not at all.  But it does set the stage for a trader willing to place a contrarian bet.

IBB Example Trade

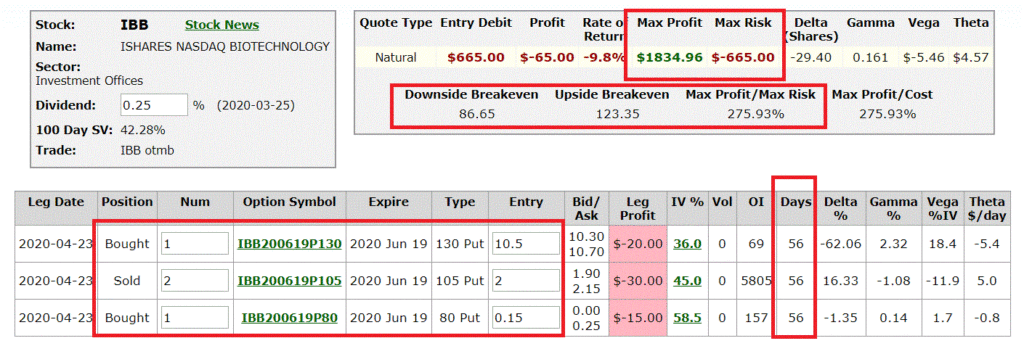
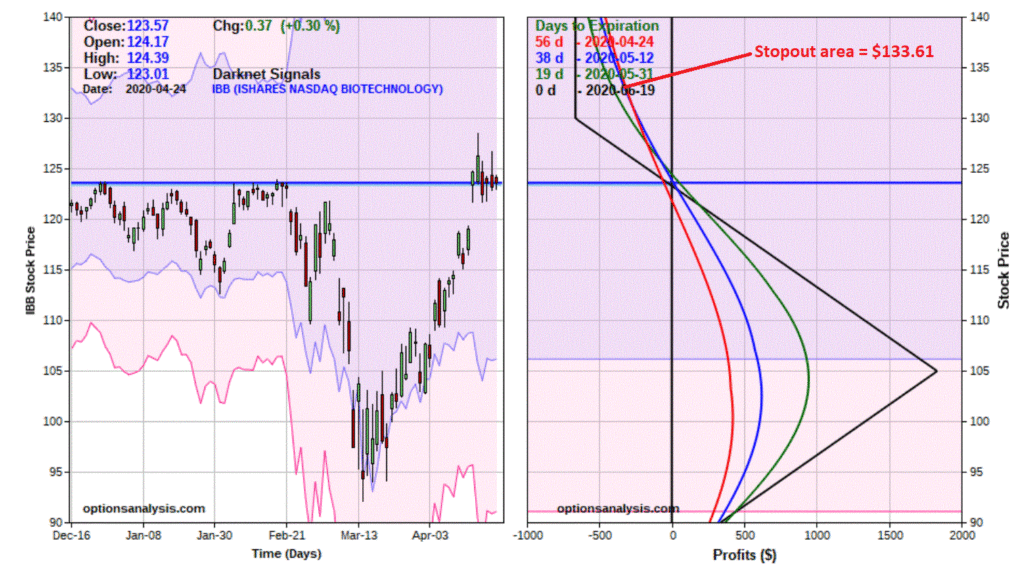
In this period of extreme volatility and uncertainty, one of the keys to success to is make small bets – i.e., don’t take big risks on any given trade.  The trade displayed in Figures 6 and 7 is referred to as an “Out-of-the-money put butterfly spread”, or “OTM put fly” for short.

The trade involves:

*Buying 1 Jun20 IBB 130 put @ $10.50

*Selling 2 Jun20 IBB 105 puts @ $2.00

*Buying 1 Jun20 IBB 80 put @ $0.15

Figure 6 – IBB OTM Put Fly details (Courtesy www.OptionsAnalysis.com)

Figure 7 – IBB OTM Put Fly risk curves (Courtesy www.OptionsAnalysis.com)

Trade Management

*The trade costs $665 to enter, which represent the maximum risk on the trade

*We will use the all-time July 2015 high of $133.60 as our “uncle” point. Depending on when that price got hit this trade would lose somewhere between -$350 and $-665 (at expiration)

*Ideally, we would be looking for an opportunity to make at least 50% of capital risked – i.e., a profit of at least +$330.  Should this target be reached we can then decide to either adjust the trade, take a profit or continue to “let it ride.” 

*As you can see in Figure 8, if IBB does break lower, time decay begins to work in our favor

*We must also note that the risk curves will begin to “roll over” if price plunges down to near $105 a share, so we would want to exit the trade before allowing that to happen.

Summary

As per usual, I am not “predicting” that IBB will decline in price.  That would certainly go against the conventional wisdom (which – just for the record – is essentially the genesis of contrarian speculation).  Likewise, I am not “recommending” this trade.  It serves simply as an example of one way to play a bearish contrarian setup.

Jay Kaeppel

Disclaimer: The information, opinions and ideas expressed herein are for informational and educational purposes only and are based on research conducted and presented solely by the author.  The information presented represents the views of the author only and does not constitute a complete description of any investment service.  In addition, nothing presented herein should be construed as investment advice, as an advertisement or offering of investment advisory services, or as an offer to sell or a solicitation to buy any security.  The data presented herein were obtained from various third-party sources.  While the data is believed to be reliable, no representation is made as to, and no responsibility, warranty or liability is accepted for the accuracy or completeness of such information.  International investments are subject to additional risks such as currency fluctuations, political instability and the potential for illiquid markets.  Past performance is no guarantee of future results.  There is risk of loss in all trading.  Back tested performance does not represent actual performance and should not be interpreted as an indication of such performance.  Also, back tested performance results have certain inherent limitations and differs from actual performance because it is achieved with the benefit of hindsight.

They Report, You Decide, I’m Confused

I probably shouldn’t say this, but I guess it’s “true confession” time.  I honestly don’t know how this all plays out in the end.  In one moment, I take the hopeful stance that once we are “released”, a strong recovery will unfold and things won’t be as bad as the “gloomers and doomers” say it will.

And then in another moment I envision exactly the scenario that they are plying.  And I picture the worst. 

The reality – I think – is that:

*Compelling, cogent arguments can be made in both directions

*Absolutely nobody knows for sure

Which means that:

*Essentially everything that everyone writes or says about “the post-corona” period is nothing more than theory and conjecture. 

*From an investor’s standpoint it means you really do need to be “prepared for anything” and that a little bit of flexibility in your portfolio is important.

*From a trader’s standpoint you need to recognize that there is presently great opportunity – associated with elevated risk.  It’s a great time to be a trader – but it is important to keep individual bets small.  Big winners will take care of themselves, but on the losing side of the equation things can happen very quickly nowadays.  So take extra care to limit risk.

To give you a flavor of the endless conundrum I keep running up against, feel free to peruse these two compelling, cogent – and diametrically opposed articles:

Bear Market Will Now Enter A New And More Explosive Stage

The U.S. stock market may enjoy the biggest rally ever when the pandemic is over

Jay Kaeppel

Disclaimer: The information, opinions and ideas expressed herein are for informational and educational purposes only and are based on research conducted and presented solely by the author.  The information presented represents the views of the author only and does not constitute a complete description of any investment service.  In addition, nothing presented herein should be construed as investment advice, as an advertisement or offering of investment advisory services, or as an offer to sell or a solicitation to buy any security.  The data presented herein were obtained from various third-party sources.  While the data is believed to be reliable, no representation is made as to, and no responsibility, warranty or liability is accepted for the accuracy or completeness of such information.  International investments are subject to additional risks such as currency fluctuations, political instability and the potential for illiquid markets.  Past performance is no guarantee of future results.  There is risk of loss in all trading.  Back tested performance does not represent actual performance and should not be interpreted as an indication of such performance.  Also, back tested performance results have certain inherent limitations and differs from actual performance because it is achieved with the benefit of hindsight.
For the Love of God DO NOT Buy USO

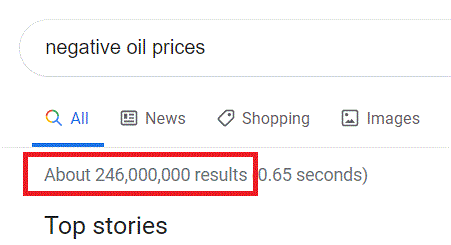
As strange as it may sound, I typically avoid trying to be “topical.”  In other words, instead of writing about “the news of the day”, I tend to wander the darker corridors of “a market-addled mind.”  Which is why for example, I didn’t write a long piece discussing the fact that March 2020 crude oil futures fell to a negative price.  I simply felt that the 246,000,000 other articles on the topic covered it fairly thoroughly.

Figure 1 – Crude oil futures fell to a negative price (have you heard?)

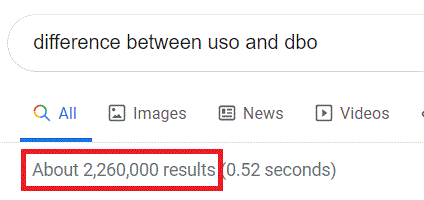
I did however write about ticker DBO – one of several ETFs that purportedly are designed to track the price of crude oil.  Two others that come to mind are USO and USL.  Each is traded in a different manner.  I have never really written about this as I feel that the 2,260,000 other articles on the topic covered it fairly thoroughly.

Figure 2 – Differences in oil ETFs

However, given the amount of trading going on in ticker USO, apparently no one is reading the other 2,260,000 articles on the topic so for the benefit of JOTM readers I will spell it out as succinctly as possible. 

DO NOT BUY USO!!!!

Can’t get much more succinct than that.  The problem with USO is known as “contango” – the problem with writing about contango is that as soon as people read that word their eyes start to get heavy, their head starts to hurt and they instantly think of something (anything) else that they’d rather be thinking about.

Which is really the only plausible explanation as to why anyone would buy USO at this point.

Now a slightly longer explanation involving tickers USO and DBO.  Each hold crude oil commodity futures – the difference is in which contract months they hold and the amount of trading volume for each.  For the record, ticker USO got into the minds of traders first and is far and away the most actively traded – which, as we will see in a moment, makes almost no sense for people who want to play the long side of crude oil.

The Difference as Succinctly as Possible

*USO holds the nearest actively traded crude oil futures contract month and DBO does not.

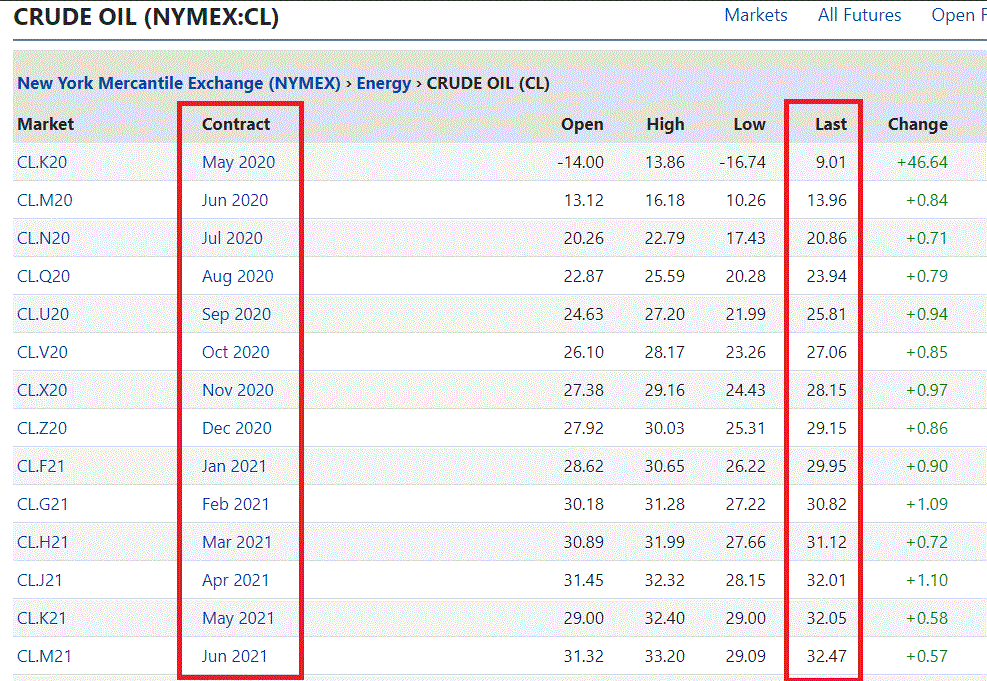
Before even trying to explain why this matters see Figure 3 and note that the price for each successive contract month is higher than the month before it.  This is important.  This is the definition of “contango’, i.e., future months are more expensive than nearer months.  The opposite situation is referred to as “backwardation.” WAKE UP AND DO NOT STOP READING!!!

Figure 3 – Crude oil futures prices (Courtesy: www.BarChart.com)

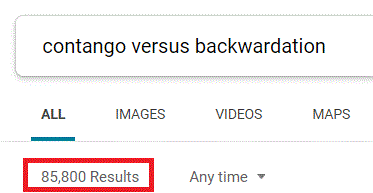
So, ticker USO simply “rolls” from one month to the next.  Because each month is more expensive than the last it costs more each month to buy a given contract.  This depresses the price of USO over time, and “No”, I am not going to explain it any further than that! If you wish a more detailed explanation, please refer to these 85,000 other articles on the topic.

Figure 4 – Contango versus Backwardation

An Even More Detailed Look at USO and DBO

To make (my) life simpler I am going to lift text directly from this article at www.Nasdaq.com.  

USO

This is the largest and actively traded ETF in the oil space with AUM of $3.96 billion and average daily volume of around 527.15 million shares. The fund provides investors with exposure to front-month oil futures contract traded on the NYMEX. The expense ratio comes in at 0.74%.

As traders need to roll from one futures contract to another in order to avoid delivery, the fund is susceptible to roll yield. Notably, roll yield is positive when the futures market is in backwardation and negative when the futures market is in contango. Basically, if the price of the near month contract is higher than the next month futures contract, this is backwardation and the opposite holds true for contango.

Also, from http://www.uscfinvestments.com/uso , they state:

The United States Oil Fund® LP (USO) is an exchange-traded security designed to track the daily price movements of West Texas Intermediate (“WTI”) light, sweet crude oil. USO issues shares that may be purchased and sold on the NYSE Arca.

The investment objective of USO is for the daily changes in percentage terms of its shares’ NAV to reflect the daily changes in percentage terms of the spot price of light, sweet crude oil delivered to Cushing, Oklahoma, as measured by the daily changes in price of USO’s Benchmark Oil Futures Contract, less USO’s expenses.

USO’s Benchmark is the near month crude oil futures contract traded on the NYMEX. If the near month futures contract is within two weeks of expiration, the Benchmark will be the next month contract to expire. The crude oil contract is WTI light, sweet crude oil delivered to Cushing, Oklahoma.

USO invests primarily in listed crude oil futures contracts and other oil-related futures contracts, and may invest in forwards and swap contracts. These investments will be collateralized by cash, cash equivalents, and US government obligations with remaining maturities of two years or less.

If you want to know exactly what USO holds, see this link http://www.uscfinvestments.com/holdings/uso

DBO

Unlike USO, this ETF follows the DBIQ Optimum Yield Crude Oil Index Excess Return plus the interest income from the fund’s holdings of primarily US Treasury securities. The Index employs the rules-based approach when rolling from one futures contract to another in order to minimize the effect of contango.

Instead of automatically rolling into the near-month oil futures contract, the benchmark selects the futures contract with a delivery month within the next 13 months, when the best possible “implied roll yield” is generated. As a result, DBO potentially maximizes the roll benefits in backwardated markets and minimize the losses from rolling in contangoed markets.

If you want to know exactly what DBO holds, see this link https://www.invesco.com/us/financial-products/etfs/holdings?ticker=DBO

Why This All Matters

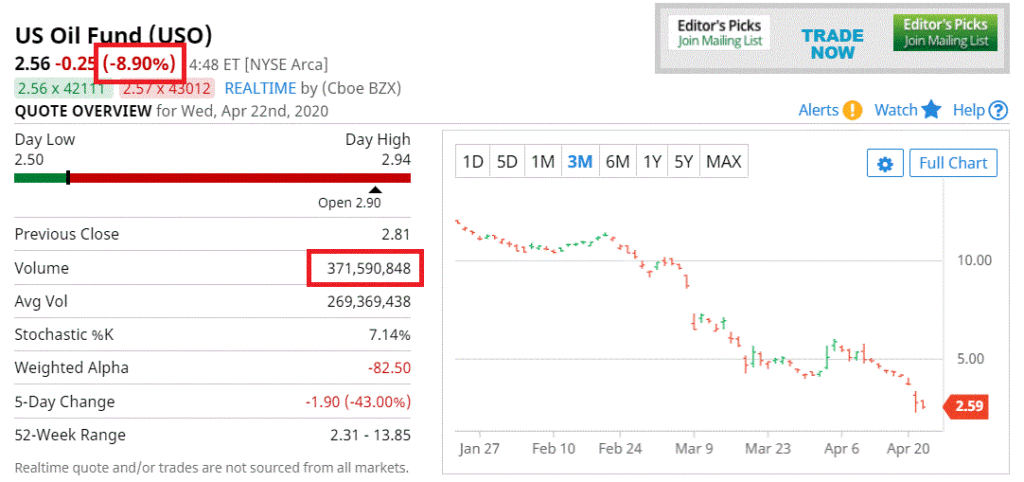
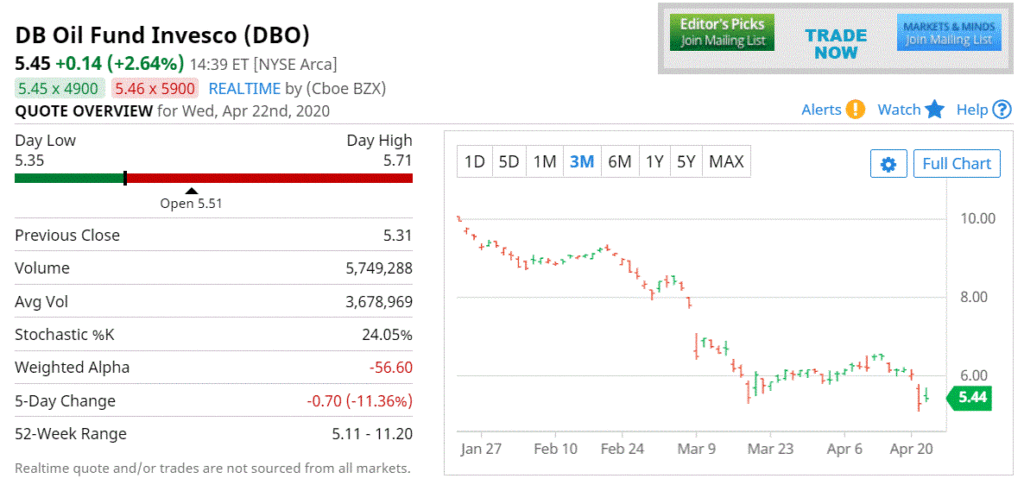
Note the price action for USO and DBO sometime during the day on 4/22/20

Figure 5 – Ticker USO (lots of people buying, lots of people losing money)

Figure 6 – Ticker DBO (not as many people buying, but making money – at least today – versus buyers of USO who are losing money today)

Note:

*Both ETFs hold crude oil futures

*USO is DOWN -8.9% on the day

*DBO is UP +2.64% on the day

YET:

*USO has traded over 371 million shares today

*DBO has traded just under 6 million shares today

So the question is “why are people buying USO?”

Historical Performance

First, please make sure you are sitting down.  Since 12/31/2007 USO has lost over 96% of its value.  DBO has lost “only” 83% of its value.

This raises the question, “why is anyone buying either one of these ETFs?” For the record I addressed this to some degree in this article.  Bottom line:

*Chances are good that crude oil will not be dirt cheap forever

*Whenever and wherever the bottom may be, it may prove to be a once in a generation buying opportunity

*If I do decide to play the long side of crude oil AND crude oil futures are still in contango, I sure the h%^ am going to buy DBO and NOT USO.

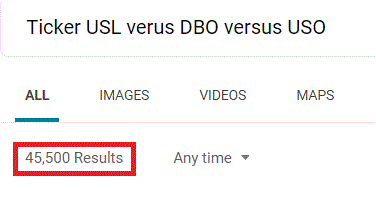
*Also, for the record, another alternative might be ticker USL.

For more information please see these 45,500 articles.

Figure 7

Jay Kaeppel

Disclaimer: The information, opinions and ideas expressed herein are for informational and educational purposes only and are based on research conducted and presented solely by the author.  The information presented represents the views of the author only and does not constitute a complete description of any investment service.  In addition, nothing presented herein should be construed as investment advice, as an advertisement or offering of investment advisory services, or as an offer to sell or a solicitation to buy any security.  The data presented herein were obtained from various third-party sources.  While the data is believed to be reliable, no representation is made as to, and no responsibility, warranty or liability is accepted for the accuracy or completeness of such information.  International investments are subject to additional risks such as currency fluctuations, political instability and the potential for illiquid markets.  Past performance is no guarantee of future results.  There is risk of loss in all trading.  Back tested performance does not represent actual performance and should not be interpreted as an indication of such performance.  Also, back tested performance results have certain inherent limitations and differs from actual performance because it is achieved with the benefit of hindsight.
A Quick Lesson on the Future for Bonds

Buying bonds or bond funds is usually done with a specific “purpose” in mind – growth of capital (if interest rates are falling), generating income, as an offset to stocks returns in a combined portfolio, and as a safe haven in times of extreme volatility.  And for each purpose the action can make sense.  For example, treasury securities have been an excellent safe haven during the recent coronavirus panic.

But does anyone really know what to expect when they get in?  As it turns out, there is a simple and useful way to estimate what to expect.  I am pretty sure that what I am about to describe is very similar to (if not unintentionally entirely lifted from) what John Bogle, the founder of Vanguard Investors described in one of his books that I read many years ago and can’t seem to locate.  It goes like this:

*To estimate the expected return for a bond over the next 10 years look at it’s current yield

Did I mention it was simple? 

Can this simple method really be of value?  Generally speaking, yes.  Specifically, it depends.  Most investors don’t buy a bond and hold it for 10 years.  They tend to move in and out of the bond market based on a desire to fulfill one of the “purposes” listed above.  Still, a little bit of foresight might be helpful, right? 

The Test

For testing purposes, I looked at the 10-year treasury. 

*I looked at the current yield on a 10-year treasury at the end of each year starting on 12/31/1972 (using data downloaded from MacroTrends.net at https://www.macrotrends.net/2016/10-year-treasury-bond-rate-yield-chart)

*I then used monthly total return data to generate 10-year bond returns for the following 10 years

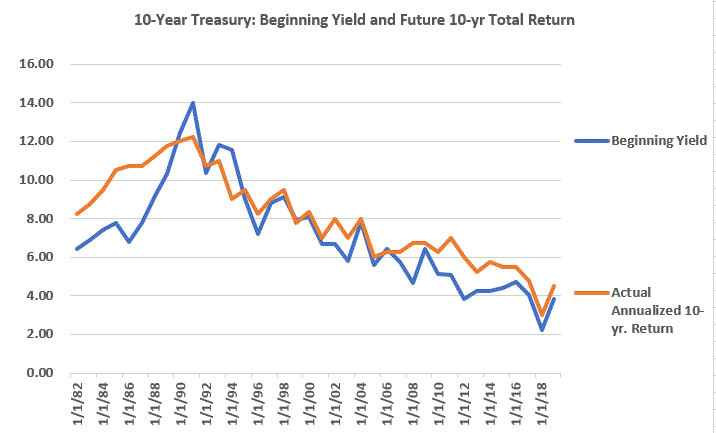
Figure 1 displays the data from Figure 2 below in a graphical format. 

*The blue line represents the beginning current yield at the start of each 10-year test period and the orange line displays the annualized total return over the following 10 years.

The correlation between beginning yield at the start of each 10-year test period and subsequent 10-year return is fairly obvious. For the record, the correlation between the beginning yield and the subsequent 10-year return in 0.80 (1.00 means an exact match).

Figure 1 – End of year 10-year yield and subsequent 10-year annualized return

As you can see in Figures 1 and 2, as long as yields are declining, total return roughly equals initial starting yield plus some modest price appreciation, hence the reason the orange line in Figure 1 (total 10-year annualized return) is typically above the blue line (initial starting yield).

Technical Note On Data Used

*The first month of data I have for the Bloomberg Barclays 10-year Treasury Index is January 1992. 

*So from January 1973 through December 1991 I used the Bloomberg Barclay’s Intermediate Index (which technically correlates more closely with a 3-7 year bond) to calculate total returns for bonds;

*Starting in January 1992, I used the 10-year treasury index to calculate total returns for bonds.  I wanted to run the longest test I could, plus I am not conducting a precise science experiment here, only highlighting a general trend, so if we end up mixing red apples with green apples a bit, so be it.

Figure 2 displays the data. 

*Column 1 is the start date

*Column 2 is the end date

*Column 3 is the 10-year yield on the start date

*Column 4 is the actual annualized return for intermediate-term treasuries over the subsequent 10-year test period

For example, we see that on 12/31/1972 the 10-year yield was 6.41%.  Over the next 10 years the 10-year bond achieved an average annual total return of 8.25%.

Start
Date
End
Date
Beginning
Yield
Actual Annualized
10-yr. Return
12/31/72 12/31/82 6.41 8.25
12/31/73 12/31/83 6.90 8.75
12/31/74 12/31/84 7.40 9.50
12/31/75 12/31/85 7.76 10.50
12/31/76 12/31/86 6.81 10.75
12/31/77 12/31/87 7.78 10.75
12/31/78 12/31/88 9.15 11.25
12/31/79 12/31/89 10.33 11.75
12/31/80 12/31/90 12.43 12.00
12/31/81 12/31/91 13.98 12.25
12/31/82 12/31/92 10.36 10.75
12/31/83 12/31/93 11.82 11.00
12/31/84 12/31/94 11.55 9.00
12/31/85 12/31/95 9.00 9.50
12/31/86 12/31/96 7.23 8.25
12/31/87 12/31/97 8.83 9.00
12/31/88 12/31/98 9.14 9.50
12/31/89 12/31/99 7.93 7.75
12/31/90 12/31/00 8.08 8.36
12/31/91 12/31/01 6.71 7.00
12/31/92 12/31/02 6.70 8.00
12/31/93 12/31/03 5.83 7.00
12/31/94 12/31/04 7.84 8.00
12/31/95 12/31/05 5.58 6.00
12/31/96 12/31/06 6.43 6.25
12/31/97 12/31/07 5.75 6.25
12/31/98 12/31/08 4.65 6.75
12/31/99 12/31/09 6.45 6.75
12/31/00 12/31/10 5.12 6.25
12/31/01 12/31/11 5.07 7.00
12/31/02 12/31/12 3.83 6.00
12/31/03 12/31/13 4.27 5.25
12/31/04 12/31/14 4.24 5.75
12/31/05 12/31/15 4.39 5.50
12/31/06 12/31/16 4.71 5.50
12/31/07 12/31/17 4.04 4.75
12/31/08 12/31/18 2.25 3.00
12/31/09 12/31/19 3.85 4.50

Figure 2 – End of year 10-year yield and subsequent 10-year annualized return %

*For the record, I rounded the 10-year annualized return to the nearest quarter percent.

The Future

At the end of 2019, the 10-year yield was roughly 1.9% (it is presently in the 0.7% range).  If history is a guide it suggests that bond investors will need to be even more strategic in how they utilize bonds in the years ahead, as simply buying and holding low yield bonds for long periods of time appears unlikely to generate significant returns.

Jay Kaeppel

Disclaimer: The information, opinions and ideas expressed herein are for informational and educational purposes only and are based on research conducted and presented solely by the author.  The information presented represents the views of the author only and does not constitute a complete description of any investment service.  In addition, nothing presented herein should be construed as investment advice, as an advertisement or offering of investment advisory services, or as an offer to sell or a solicitation to buy any security.  The data presented herein were obtained from various third-party sources.  While the data is believed to be reliable, no representation is made as to, and no responsibility, warranty or liability is accepted for the accuracy or completeness of such information.  International investments are subject to additional risks such as currency fluctuations, political instability and the potential for illiquid markets.  Past performance is no guarantee of future results.  There is risk of loss in all trading.  Back tested performance does not represent actual performance and should not be interpreted as an indication of such performance.  Also, back tested performance results have certain inherent limitations and differs from actual performance because it is achieved with the benefit of hindsight.
An Energetic Reminder of Why Patience is So Important

Let’s face it, these are difficult times.  There are likely a lot of opportunities shaping up.  Unfortunately, there are also a lot of associated risks.  For the “average investor” (you know who you are) NOT “taking the plunge” into troubled waters is likely the best play.

But for the rest of you (you definitely know who you are), consider these three thoughts:

#1. Do not put your head in the sand

From a mental health standpoint it may be best for you to be on the sidelines – that’s up for each individual to decide.  But there ARE opportunities forming and taking place that you might do well to consider

#2. When you bet in a volatile situation, bet small

Fight the urge to “be a hero”.  If you want to bet on a trend continuation or a trend reversal in something, go ahead.  Just DO NOT risk a lot of money on that position.  If you get it right you will probably do pretty well even with a small allocation.  If you get it wrong you don’t want to get hurt badly – financially and/or emotionally (where you end up second-guessing yourself for a long time to come).

#3. Be patient

These are absolutely abnormal times, and yes, it is OK to wait for the path to become a little clearer, or at least to “calm down” a bit before acting.

Some Thoughts

Here and here I intimated on several occasions that – to summarize – “we will likely look back on this period as a great buying opportunity in the energy sector.”  At the same time, in each piece I also stated that – paraphrasing here – “I am not quite ready to take the plunge yet.”  The old adage about the dangers in trying to “catch a falling safe (or knife if you prefer)” were top of mind. 

I still hold both of these beliefs.  I do think that terrific bargains will emerge/are emerging in the energy sector.  I also still think I am not quite ready to dive in.  What really swayed my thinking in terms of staying on the energy sidelines is all that I have been reading about the effect that all of this is likely to have on the shale oil business in the U.S. – i.e., a lot of bankruptcies if crude remains below $30 a barrel (let alone below $0 a barrel).  In this article I wrote about TAN, XLE, XOP and PAGP.  Interestingly, despite all of the turmoil in the crude oil market, all four of these are fairly nicely above their price level on the day the article was published.  Two thoughts on energy/crude:

Ticker DBO

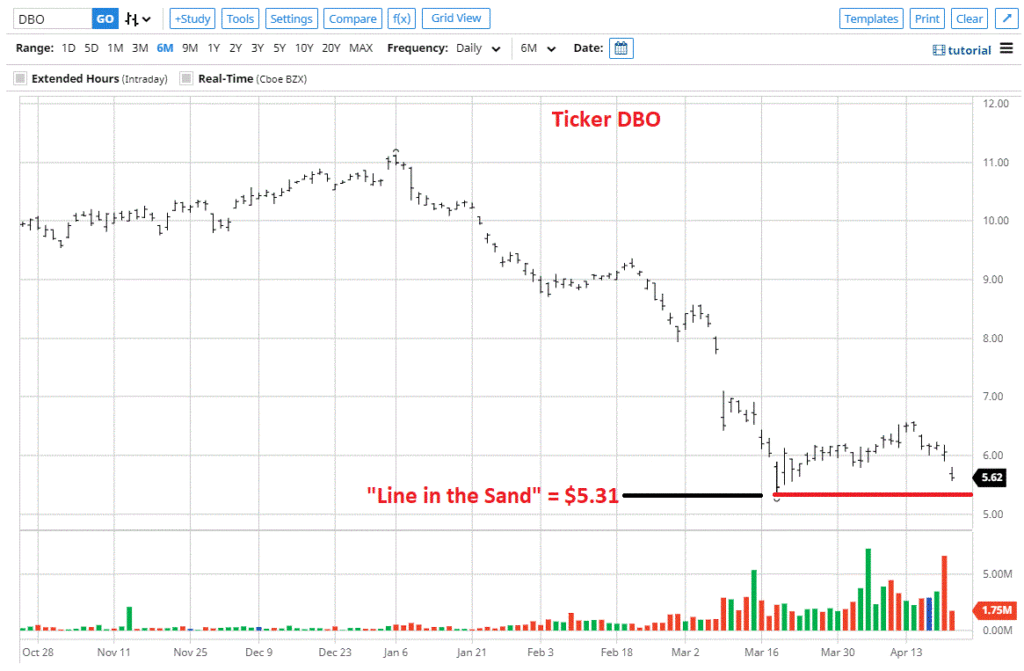
DBO is an ETF that does NOT roll from one futures contract month to the next (which can an extremely negative results if farther out months are more expensive than the current month).  The fund tracks the DBIQ Opt Yield Crude Oil Index ER which is a rules-based index composed of futures contracts on light sweet crude oil (WTI) that aims to mitigate negative roll yield in its contract selection. The Fund is rebalanced & reconstituted annually in November. 

Figure 1 displays a daily chart of DBO – note that (so far) it has not dropped below the 3/18 low of $5.31 a share.  Note that I am not making a prediction one way or the other about whether it eventually will or won’t take out that price level.  It seems very optimistic to think that it will not.

Still, I find it interesting that in light of the roughly 7,257 articles about “negative crude oil prices”, this one has yet to hit a new low.

Figure 1 – Ticker DBO (down, but not yet “out”) (courtesy: www.BarChart.com)

Make no mistake, I am not jumping in here to buy DBO – patience, remember? – but I am keeping a pretty close eye on things.  While I have no illusions that $5.31 on DBO is some “magical” number, wherever and whenever this thing bottoms out, it may offer up a significant low-priced opportunity.  There are two key questions:

*How long will the oil glut last?

*Do you think it will last forever?

No one knows the answer to the first question, but I personally have a hunch regarding the second.  At the same time, I have been patient and avoided diving into the energy sector so far, so what’s a little longer?

Ticker PAGP

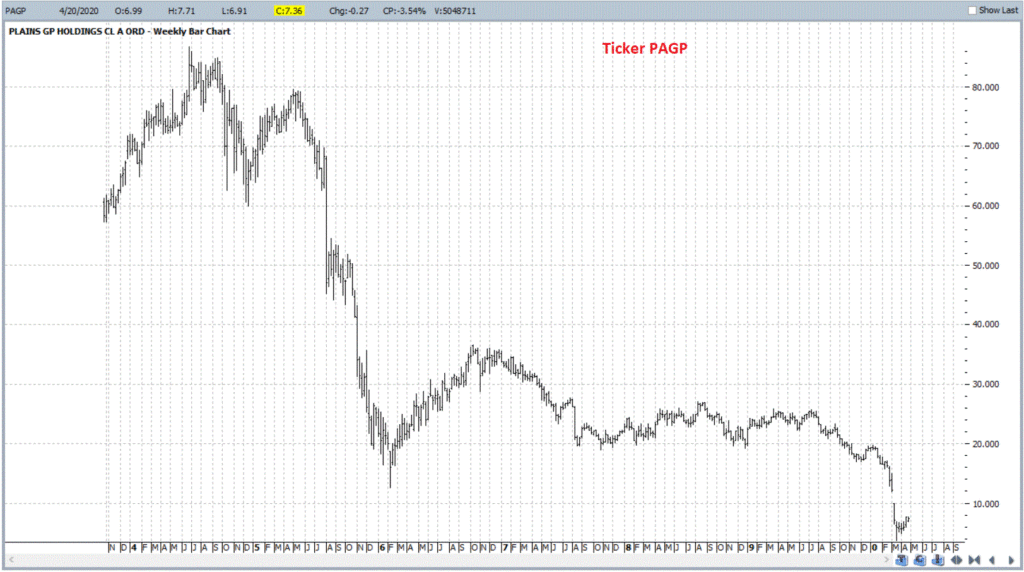
PAGP (Plains Group Holdings) essentially is in the business of “moving energy” – pipelines, trucks, ships, etc.  A pretty lousy place to be at this exact moment in time.  Figure 2 displays the an extremely dismal picture of a stock that fell from $97.74 in 2014 to a recent low of $3.04 a share. 

Figure 2 – Ticker PAGP (Courtesy ProfitSource by HUBB)

Again, I can’t state categorically that there is an opportunity here.  And even if one did, this is a great example of something crying out for a very small bet, given the high degree of uncertainty, risk and the fact that the stock has cratered.

But again, there is a key question to consider:

*Will energy continue to need to be moved in the future?

Even if the answer is “Yes” it does NOT mean that the price of PAGP stock is destined to move sharply higher. It does however suggest that it is not headed to $0.

So here again, I am trying my best to keep my head out of the shale, er, sand.

Patience, people, patience.

Jay Kaeppel

Disclaimer: The information, opinions and ideas expressed herein are for informational and educational purposes only and are based on research conducted and presented solely by the author.  The information presented represents the views of the author only and does not constitute a complete description of any investment service.  In addition, nothing presented herein should be construed as investment advice, as an advertisement or offering of investment advisory services, or as an offer to sell or a solicitation to buy any security.  The data presented herein were obtained from various third-party sources.  While the data is believed to be reliable, no representation is made as to, and no responsibility, warranty or liability is accepted for the accuracy or completeness of such information.  International investments are subject to additional risks such as currency fluctuations, political instability and the potential for illiquid markets.  Past performance is no guarantee of future results.  There is risk of loss in all trading.  Back tested performance does not represent actual performance and should not be interpreted as an indication of such performance.  Also, back tested performance results have certain inherent limitations and differs from actual performance because it is achieved with the benefit of hindsight.
The Dow and the “Dead Zone”

The Dow “number to beat” at the moment is 27,046.23.  Why?  Because that’s where it closed October of 2019 (you remember, back in the “Good Old Days”).  If the Dow closes the month of April below 27,046.23 it presents a negative signal for the next six months, generally speaking.

The Track Record

So, for the purposes of this test we will break the year into two 6-month periods:

*November through April (the “Power Zone”) and May through October (“the Dead Zone”)

Then we will:

*look at how the Dow performs during the “6-month Dead Zone” in those years where the Dow finishes the “6-month Power Zone” with a loss

In other words, how does the Dow perform May through October after November through April registers a loss?

First the Good News

The Good News is that 44% of the time a loss during the 6-month Power Zone was followed by a gain during the subsequent 6-monht Dead Zone.  So, it is not like a November through April decline is a sure-fire sign of impending trouble. 

Still, it is a warning sign as we will see next.

Now the Bad News

When the 6-month Power Zone showed a loss, the Dow during the subsequent 6-month Dead Zone:

*Lost ground 56% of the time

*The average loss for all periods was -3%

*The average gain during up periods was +11.1%

*The average loss during down periods -14.3%

In a nutshell, the percentage of winning trades was less than 50%, and the average loser was bigger than the average winner. 

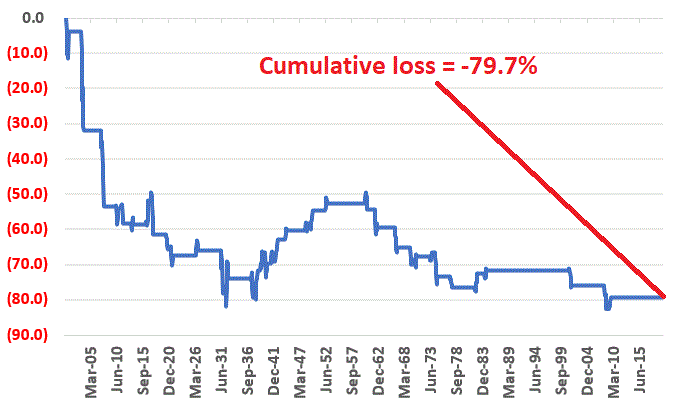
Figure 1 displays the cumulative price return for the Dow if held only during May through October after November through April showed a loss, starting in 1900.

Figure 1 – Cumulative Dow % +(-) during 6-month Dead Zone after 6-month Power Zone shows a loss (1900-2019)

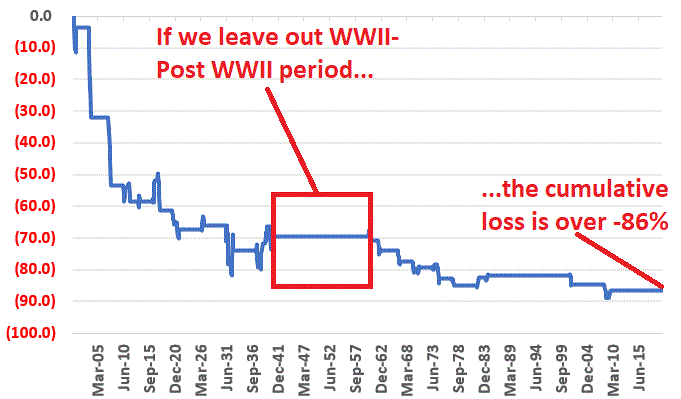
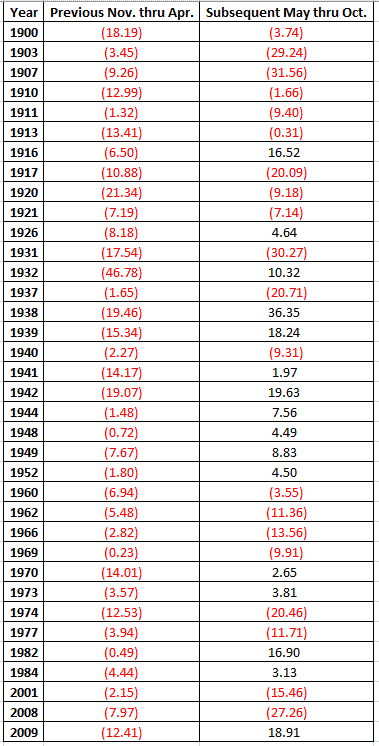
In sum, the Dow lost -79.2% during these periods.  It is interesting to note that from 1941 through 1952 there were six consecutive times when a down Nov. through Apr. was followed by an up May through Oct. (see Figure 3).

If we take out this WWII-post WWII period the cumulative loss was -90.2% as shown in Figure 2 and the percentage of winning trades drops from 44% to 33%.

Figure 2 – Cumulative Dow % +(-) during 6-month Dead Zone after 6-month Power Zone shows a loss – excluding WWII-Post WWII years of 1941-1952 (1900-2019)

Figure 3 displays the year-by-year results, i.e., column 2 shows the Nov. through Apr. decline and column 3 displays the Dow % + (-) over the next six months.

Figure 3 – Year-by-year results

Summary

If the Dow ends April 2020 with a 6-month loss does that mean that the market is “doomed” to decline in the following 6 months.  Obviously not, as historically gains have followed 44% of the time. 

However, it also would be another sign that caution would be in order.

Jay Kaeppel

Disclaimer: The information, opinions and ideas expressed herein are for informational and educational purposes only and are based on research conducted and presented solely by the author.  The information presented does not represent the views of the author only and does not constitute a complete description of any investment service.  In addition, nothing presented herein should be construed as investment advice, as an advertisement or offering of investment advisory services, or as an offer to sell or a solicitation to buy any security.  The data presented herein were obtained from various third-party sources.  While the data is believed to be reliable, no representation is made as to, and no responsibility, warranty or liability is accepted for the accuracy or completeness of such information.  International investments are subject to additional risks such as currency fluctuations, political instability and the potential for illiquid markets.  Past performance is no guarantee of future results.  There is risk of loss in all trading.  Back tested performance does not represent actual performance and should not be interpreted as an indication of such performance.  Also, back tested performance results have certain inherent limitations and differs from actual performance because it is achieved with the benefit of hindsight.
To Junk or Not to Junk

High-yield corporate bonds suffered – no surprise – a terrible 1st quarter of 2020.  The Bloomberg Barclays High Yield Corporate Index (heretofore HYCI) experienced its 2nd worst quarter ever, losing -12.68%.  This is obviously bad news.  Or is it?  Well if you were invested then, the answer is “yes”.  But going forward, the answer is not so clear cut.  First the potential Good News. 

See also JayOnTheMarkets.com: Blood in the Mid-Cap Street = Opportunity

The Potential Good News

Figure 1 displays 11 previous instances when the HYCI lost -3.5% or more during a given quarter, and the performance of the index in the subsequent 3, 6, 9- and 12-month periods. 

Figure 1 – Bloomberg Barclays High Yield Corporate Index performance after a quarter lost -3.5% or more; 1983-2020

Figure 2 displays the cumulative growth of the HYCI if held for 12 months after each of the worst quarters displayed in Figure 1.

Figure 2 – Cumulative % +(-) for Bloomberg Barclays in 12 months after quarter than saw a decline of -3.5% or more; 1983-2020

Clearly, the results displayed in Figures 1 and 2 are favorable and the implication is that junk bonds “should” do well in the next 6 to 12 months.  This seems like an optimal time to invoke the “past performance does not guarantee future results” mantra.

The Potential Bad News 

The outlook for corporate bonds – especially bonds of companies that were already on less than investment grade ground – going forward is more than just “murky”, it is essentially unknown and entirely unpredictable. 

On one hand a person can easily construct a “best case” outlook and project that the economy will rebound quickly once things are opened up again.  At the same time, it is just as easy to envision a pretty harrowing “worst case” scenario, one which involves a lot of companies defaulting/going bankrupt/etc. in light of the recent economic shutdown.

Anyone who tries to tell you with great certainty that it will be one of these scenarios – or somewhere in between – is merely guessing. 

Summary

The bottom line: For an investor willing to assume the risk, high yield bonds appear to be offering a decent “contrarian” bullish opportunity.  As always, I am not making a “recommendation”, just alerting you to, a) history, and b) the unique risks going forward.

An investor interesting in making this play could buy a mututal fund such as VWEHX, or an ETF such as HYG or JNK.

But whatever you do…. don’t bet the ranch.

Jay Kaeppel

Disclaimer: The information, opinions and ideas expressed herein are for informational and educational purposes only and are based on research conducted and presented solely by the author.  The information presented does not represent the views of the author only and does not constitute a complete description of any investment service.  In addition, nothing presented herein should be construed as investment advice, as an advertisement or offering of investment advisory services, or as an offer to sell or a solicitation to buy any security.  The data presented herein were obtained from various third-party sources.  While the data is believed to be reliable, no representation is made as to, and no responsibility, warranty or liability is accepted for the accuracy or completeness of such information.  International investments are subject to additional risks such as currency fluctuations, political instability and the potential for illiquid markets.  Past performance is no guarantee of future results.  There is risk of loss in all trading.  Back tested performance does not represent actual performance and should not be interpreted as an indication of such performance.  Also, back tested performance results have certain inherent limitations and differs from actual performance because it is achieved with the benefit of hindsight.