One thing that keeps me slightly optimistic these days is all the gloom and doom forecasts I read regarding the economy. Not that there isn’t plenty of truth to what is getting written. But it just seems like everyone wants to be the first one to “call the top” in the economy. Is there a way to be objective? Maybe so.
Where We Are
First let’s get the “politics” out of the way. The Democrats on one hand want Obama to get the credit for the “roaring” economy while on the other hand claiming that the economy is “not that great”. Republicans just hope to get to the next election before the next recession kicks in. All that uselessness aside, we are presently doing very well economically. Improved growth and profitability, more entrepreneurs taking the plunge, low unemployment and low inflation. We should all be happy, right? What, are you crazy? Debt, deficits, trade wars, overheated housing prices (in some areas) and a slowdown in housing sales (in other areas), an inverted yield curve and so on and so forth are all causing great angst among people who, um, choose to focus on things that cause them angst.
Despite current economic growth, pretty much anyone who knows anything about economic cycles know that “nothing lasts forever”, especially economic growth. Consider the unemployment rate. When people hear that unemployment is low they think “great!” But when they look at the history of unemployment in Figure 1, they tend to think “things can’t get any better so they are likely to get worse.” And history appears to be on their side.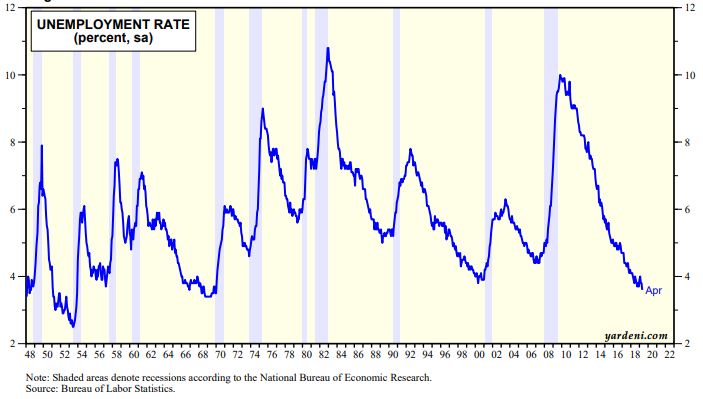 Figure 1 – U.S. Unemployment (Source: www.yardeni.com)
The U.S. and world economy seem to run on a never-ending cycle of “boom” followed by “bust”. Therefore, since things are “booming” now then we must be closing in on the next “bust” – hence the reason for all the recent negativity. And there is good reason to pay attention and remain vigilant. But that is different than just perpetually lamenting that “the end is near”.
So, what can we look at to get an objective handle on – and be able to speak intelligently about – “the economy”?
What to Follow to Assess “the Economy”
What follows is NOT intended as a “comprehensive” guide to economic forecasting. Not at all. What follows is simply a few key things that investors can watch for clues of an actual impending downturn. In other words, if these factors are not flashing warning signs, for gosh sakes, stop worrying incessantly about the economy and get back to enjoying your life for crying out loud.
But just as importantly, when they do start flashing warning signs, you must absolutely, positively resist the urge to stick your head in the sand and pretend that “all is well” (pssst, which is usually what happens at the top).
Factor #1: Leading versus Coincident Indicators
Figure 2 is from www.Yardeni.com (a source of a tremendous amount of free and useful information). It displays the ratio of the leading economic indicators to the coincident economic indicators.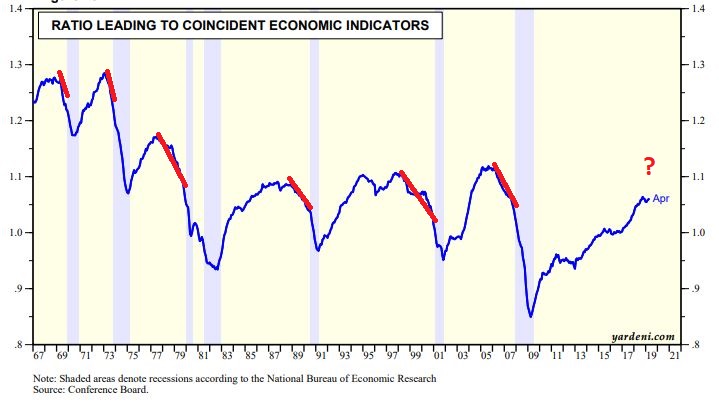 Figure 2 – Ratio of Leading to Coincident Indicators (Source: www.yardeni.com)
There are three things to note:
- The blue line rises and falls regularly
- The grey vertical areas represent period of economic recession in the U.S.
And most importantly:
- (With the caveat that anything can happen) Every recession in the past 50 years was preceded by a clearly declining trend in this ratio
The point: The line displayed in Figure 1 has stopped advancing in recent months and has begun to “squiggle”. OH MY GOD THAT MUST MEAN THE ECONOMY IS DOOMED TO FALL APART!!!!! Oh wait, no that’s not what it means. It means we should be keeping an eye on it for signs of further weakness and if further weakness does unfold we should then be alert to the fact that the economy may then come under pressure.
But let’s be honest, that’s not nearly as fun or dramatic as shouting OH MY GOD THAT MUST MEAN THE ECONOMY IS DOOMED TO FALL APART!!!!!
Factor #2: Housing Starts
There are several different ways to measure this and – unfortunately – no one best way to objectively identify a turning point. Figure 3 – also from www.Yardeni.com (I told you it is a great source for useful information) displays “Housing Starts” and “Housing Completions”. For our purposes we will focus solely on “Housing Starts”.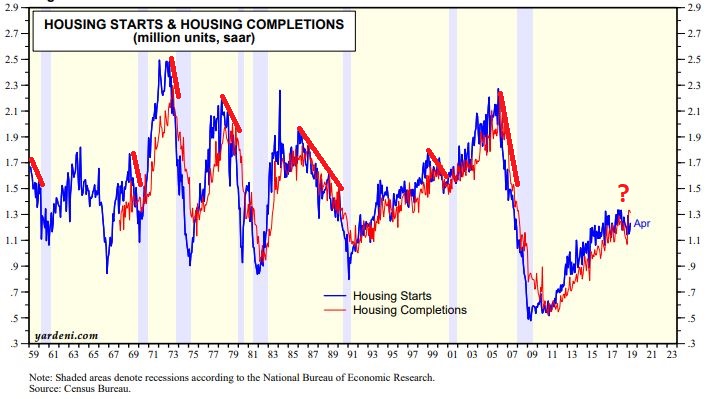 Figure 3 – Housing Starts (Source: www.yardeni.com)
What we see in Figure 3 is that Housing Starts is an extremely volatile data set. Big swings from lows to highs and vice versa, without a lot of “noise” along the way.
The point: Once again – just as with Factor #1 – every recession in the past 50 years was preceded by a clearly declining trend in this set of data. So that’s what we should be looking for.
As you can see in Figure 3, the blue line (Housing Starts) has sort of started to “chop around” of late. While one can choose to wring one’s hands if one so chooses, the more prudent thing to do is to keep a close eye and see if a clear downtrend ensues. THEN it will be a meaningful sign.
Factor #3: The Yield Curve
Nothing has generated more universal angst about “inevitable” economic disaster as the fact that certain parts of the yield curve have “inverted” (i.e., a longer-term interest rate is below a shorter-term interest rate) of late. For example, the key 10-year treasury yield has recently fallen below the 2-year yield , the 3-month and Fed Funds rate. Oh, the horror!
But here is the irony: Yes, it is absolutely, positively true that an inverted yield curve is a potential warning sign of impending economic trouble. Just not the way it is typically presented of late, i.e., OH MY GOD THE 10-YEAR YIELD DROPPED BELOW THE 2-YEAR YIELD THAT MUST MEAN THE ECONOMY IS DOOMED TO FALL APART!!!!! However, take a close look at Figure 4 from – where else – www.Yardeni.com that displays the difference between the 10-year treasury yield and the Fed Funds rate.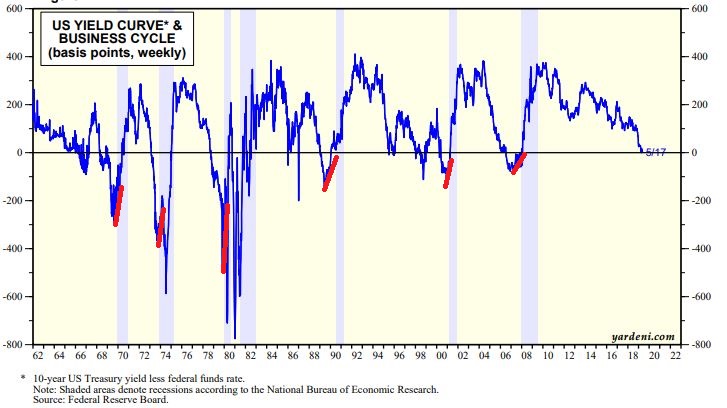 Figure 4 – 10-year treasury yield minus Fed Funds rate (Source: www.yardeni.com)
There are two important things to note – unfortunately most people only seem to focus on #1:
- Every recession in the past 50 years has been preceded by an inversion (i.e., a negative reading on this chart) of the yield curve
- However, also note that the recessions did not actually begin until after the yield curve started to rise again after first inverting.
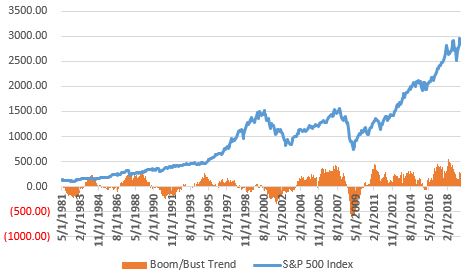
This second point is important. Why? Consider Figure 5 from www.BullMarkets.co (another terrific source of information) which shows the action of the stock market after the yield curve first inverts.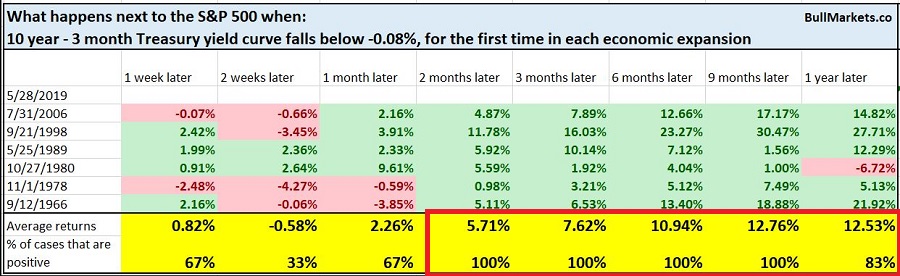 Figure 5 – S&P 500 Index performance after yield curve first inverts (Source: www.BullMarkets.co)
The fact that every previous instance was followed by higher stock prices 2, 3, 6 and 9 months later does NOT mean that things can’t be different this time around. But the information in Figure 4 does suggest that a lot of the fear and loathing and gnashing of teeth presently occurring may be misplaced.
Summary
Again, the above list is not intended to be the “be all, end all” when it comes to divining the future course of the economy. Many other indicators (Initial Unemployment Claims, Purchasing Managers Index to name just two)
I can’t tell you if the economy is about to top out and if all the current “gloom and doom” is warranted. But I would still like to offer some advice. So here goes: forget all the noise of economic prognostications and keep an eye on the indicators presented above. If either or both of the first two start to tank and/or if the yield curve begins to “un-invert” it will be time to raise your level of concern.
Until then go ahead and try to enjoy your life.
Jay Kaeppel
Disclaimer: The data presented herein were obtained from various third-party sources. While I believe the data to be reliable, no representation is made as to, and no responsibility, warranty or liability is accepted for the accuracy or completeness of such information. The information, opinions and ideas expressed herein are for informational and educational purposes only and do not constitute and should not be construed as investment advice, an advertisement or offering of investment advisory services, or an offer to sell or a solicitation to buy any security.
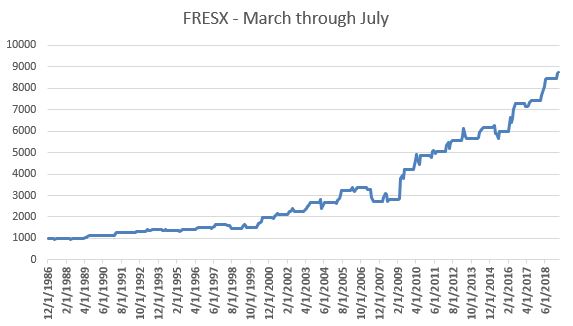 Figure 1 – Growth of $1,000 invested in FRESX March through July 1987-2019