The biotech industry is the focus of a lot of attention these days. All eyes are on myriad companies as they race to find something with which to combat Covid-19. The “conventional wisdom” is that buying interest will continue to be strong for these stocks as the company that comes up with a breakthrough will, a) make a ton of money, and b) propel the overall industry to sharply higher new highs.
And maybe the conventional wisdom will prove correct. But just for the record, it’s got a nasty history of “Not”. This opens the door for any extremely contrarian speculation.
The State of Things Biotech
Figure 1 displays a weekly chart for ticker IBB – an ETF that tracks a basket of biotech stocks. Note that price has, a) had a sharp 33% runup since March, b) has run into some significant overhead resistance.
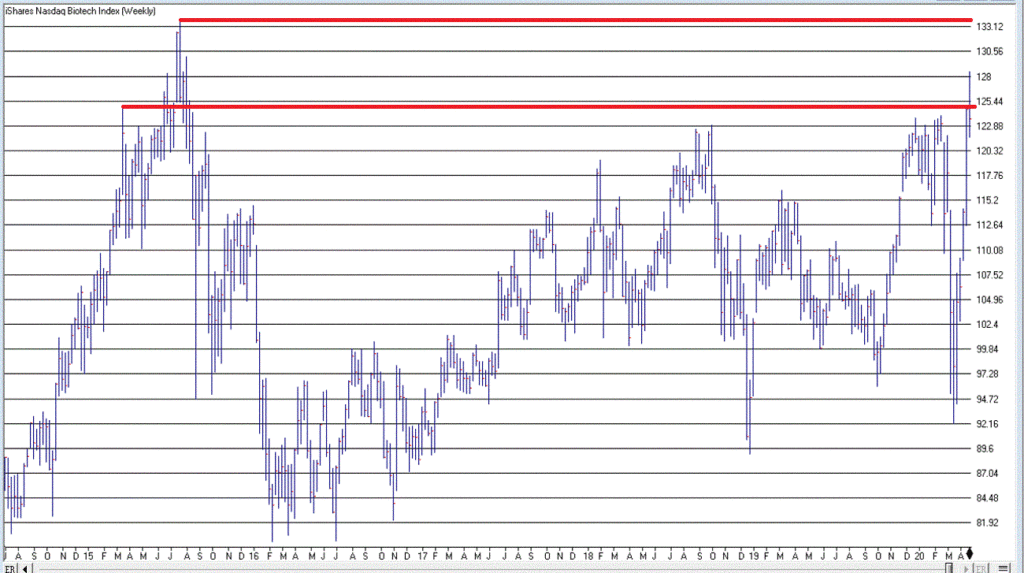
Figure 1 – Ticker IBB (Courtesy AIQ TradingExpert)
Now let’s turn our attention to www.Sentimentrader.com. Figure 2 displays ticker IBB with trader sentiment. Note that trader sentiment (referred to as “Optix”) is presently on the extreme high end of the range.
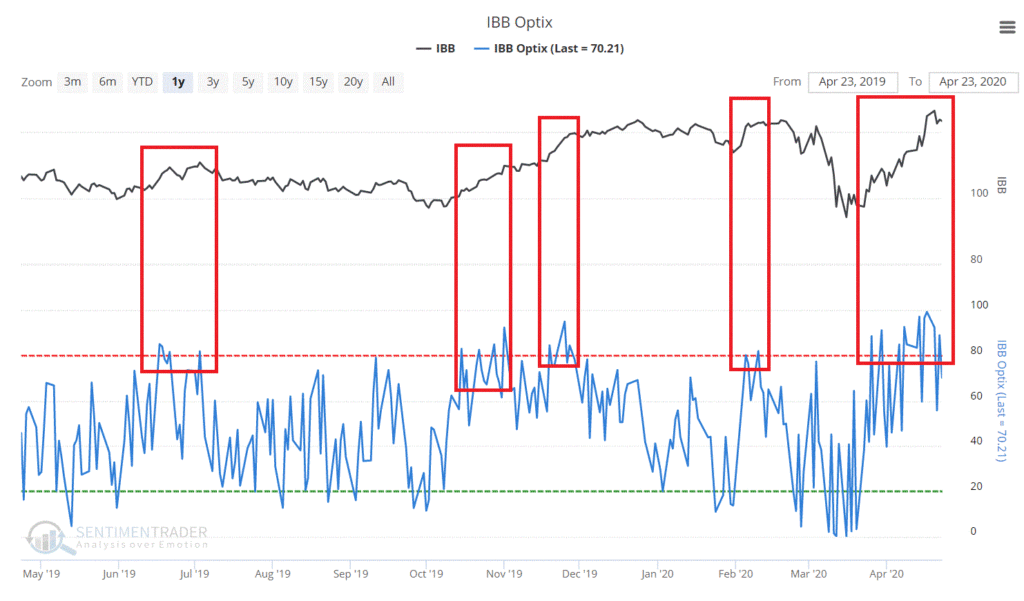
Figure 2 – Ticker IBB with trader sentiment (Courtesy Sentimentrader.com)
Now let’s see how IBB has performed when the 5-day average of IBB Optix crosses above 80%. As you can see in Figure 3, in the past 5 years there have been 12 times that this has happened. Subsequent results were not favorable.
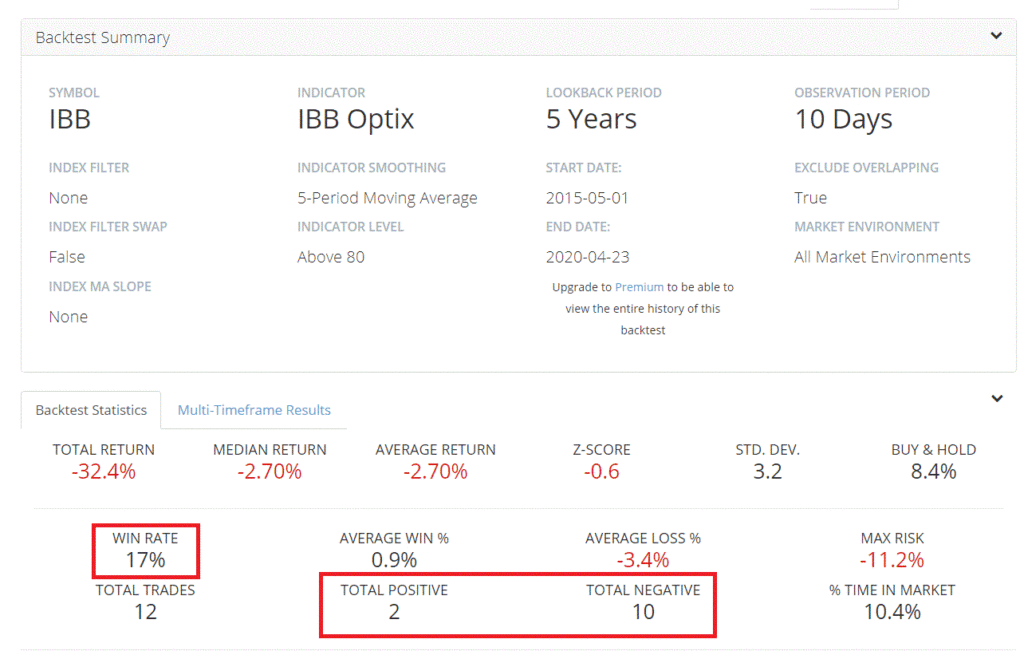
Figure 3 – IBB performance after 5-day average of Sentimentrader IBB Optix crosses above 80% (Courtesy Sentimentrader.com)
Figure 4 displays the previous instances.
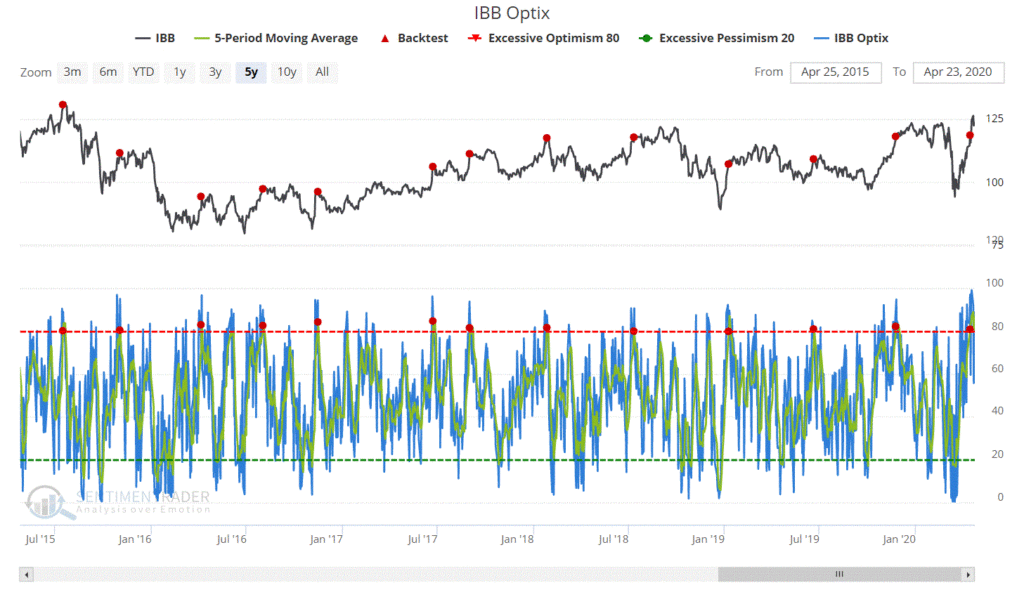
Figure 4 – IBB performance after 5-day average of Sentimentrader IBB Optix crosses above 80% (Courtesy Sentimentrader.com)
In Figure 5 we see that IBB showed a gain 2-weeks and/or 2-months later only 17% of the time.
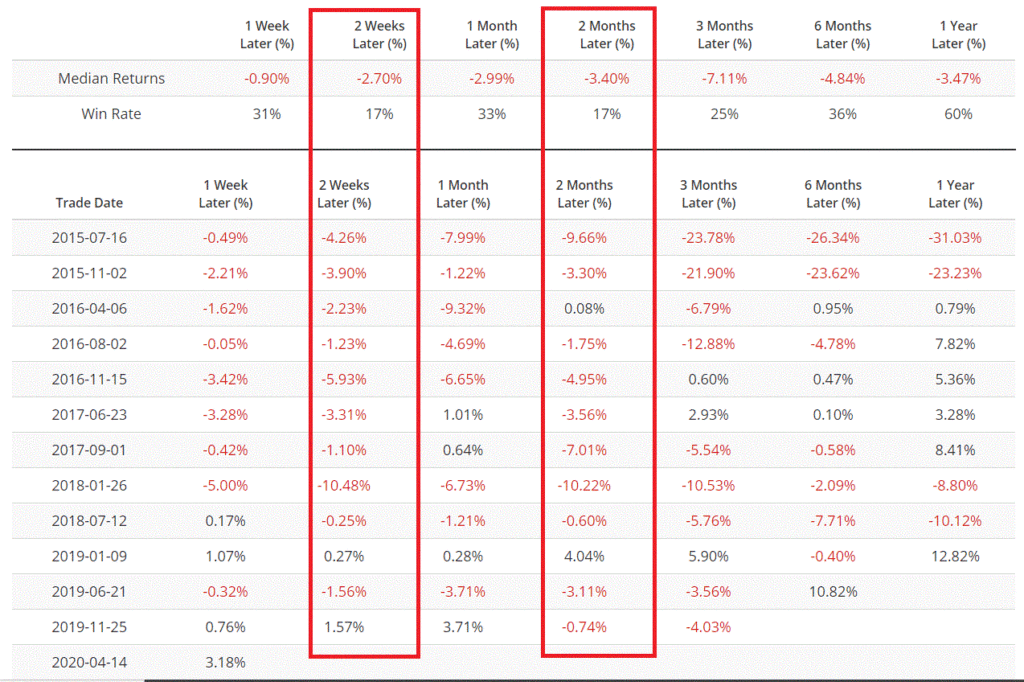
Figure 5 – IBB performance after 5-day average of Sentimentrader IBB Optix crosses above 80% (Courtesy Sentimentrader.com)
Does this mean that IBB is doomed to trade lower from here? Not at all. But it does set the stage for a trader willing to place a contrarian bet.
IBB Example Trade
In this period of extreme volatility and uncertainty, one of the keys to success to is make small bets – i.e., don’t take big risks on any given trade. The trade displayed in Figures 6 and 7 is referred to as an “Out-of-the-money put butterfly spread”, or “OTM put fly” for short.
The trade involves:
*Buying 1 Jun20 IBB 130 put @ $10.50
*Selling 2 Jun20 IBB 105 puts @ $2.00
*Buying 1 Jun20 IBB 80 put @ $0.15
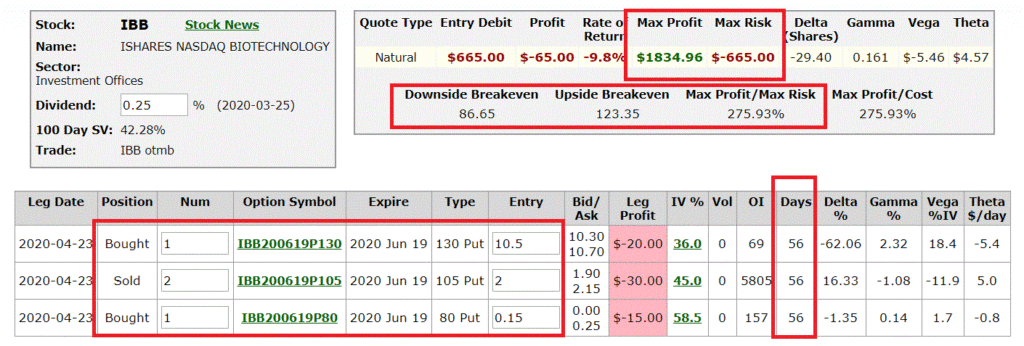
Figure 6 – IBB OTM Put Fly details (Courtesy www.OptionsAnalysis.com)
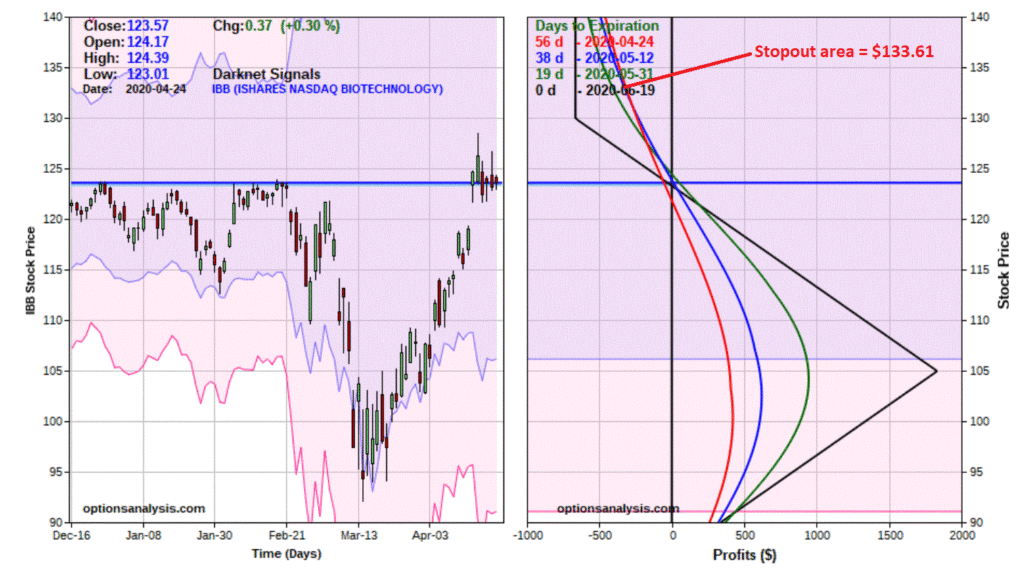
Figure 7 – IBB OTM Put Fly risk curves (Courtesy www.OptionsAnalysis.com)
Trade Management
*The trade costs $665 to enter, which represent the maximum risk on the trade
*We will use the all-time July 2015 high of $133.60 as our “uncle” point. Depending on when that price got hit this trade would lose somewhere between -$350 and $-665 (at expiration)
*Ideally, we would be looking for an opportunity to make at least 50% of capital risked – i.e., a profit of at least +$330. Should this target be reached we can then decide to either adjust the trade, take a profit or continue to “let it ride.”
*As you can see in Figure 8, if IBB does break lower, time decay begins to work in our favor
*We must also note that the risk curves will begin to “roll over” if price plunges down to near $105 a share, so we would want to exit the trade before allowing that to happen.
Summary
As per usual, I am not “predicting” that IBB will decline in price. That would certainly go against the conventional wisdom (which – just for the record – is essentially the genesis of contrarian speculation). Likewise, I am not “recommending” this trade. It serves simply as an example of one way to play a bearish contrarian setup.
Jay Kaeppel
Disclaimer: The information, opinions and ideas expressed herein are for informational and educational purposes only and are based on research conducted and presented solely by the author. The information presented represents the views of the author only and does not constitute a complete description of any investment service. In addition, nothing presented herein should be construed as investment advice, as an advertisement or offering of investment advisory services, or as an offer to sell or a solicitation to buy any security. The data presented herein were obtained from various third-party sources. While the data is believed to be reliable, no representation is made as to, and no responsibility, warranty or liability is accepted for the accuracy or completeness of such information. International investments are subject to additional risks such as currency fluctuations, political instability and the potential for illiquid markets. Past performance is no guarantee of future results. There is risk of loss in all trading. Back tested performance does not represent actual performance and should not be interpreted as an indication of such performance. Also, back tested performance results have certain inherent limitations and differs from actual performance because it is achieved with the benefit of hindsight.


Jay , I have studied your illustrated “OTM Put Fly option graph and have decide that I am at a disadvantage having come from the futures market arena and diving into your expertise head first. I do understand the terms you mentioned and occasionally I am ahead of the curve when you mention Contango and backwardation associated with “ETF”USO in your previous writing. You also mention caveats within this option strategy that may bite if not adjusted in adequate time. So would you just hold on tight if IBB made another $128+ top which it could do in the first quarter of May. Would it be wise to wait to see if that happens or would waiting for another pin-bar top increase the “IV” on rebound making more expense to put this trade on ? What are the disadvantages for me to wait for one more top to show up on the graph ? Douglas M. In N. Texas.
Douglas, Thanks for the comment. I am not entirely sure that there are “definitive” answers to your questions. But a couple of comments. 1) One problem with this type of trading is that it is “counter-trend” so there are two primary dangers – first, you can get stopped out before you even settle in, and second, that kind of loss can trigger the “what was I thinking” kind of response that can adversely affect future decision making for some time. 2) “Waiting for one more top” is always an option. You just have to be alert and on top of things or you can miss the opportunity. 3) For stock and stock-market related ETFs, IV typically declines when price rises and vice versa. So theoretically, waiting for another top could lead to a lower priced option trade (though not guaranteed). 4) Again – just for the record – everything I write on JOTM is for “educational purposes only” and should not be considered a “recommendation” by me. Take Care, Jay
I suppose timing in this matter is slightly less relevant then say , jumping into a futures contract. I have to learn to loosen the reins . Thanks for the “camp of thought ” on counter trend trading and what ramifications are involved. The nitty gritty of using the DOM (for options) on Think or Swim has certain traits that I need to technically overcome. With use of Seeking Alpha , Jay on the Markets . . and a tutorial (7 min) on ” How to Use the Think or Swim DOM for option trading on YouTube by Chad Mercer, a trader seeking familiarity in option trading can progress quickly within the market knowledg base . TOS (mentioned above) has a simmulator in two different historical modes and also a minute by minute real-time Simmulator.
Although never recommendations, Your articles are tested and true while providing fresh air in both stagnant and volitile markets, often showing how a great percentage of the time, diffusing market myths and revealing the gems necessary for success doesn’t have to be a harrowing task when you become an avid reader of Jay on the Markets. Douglas M. North Texas