Monthly Archives: July 2019

In Case Real Estate “Goes Nowhere”

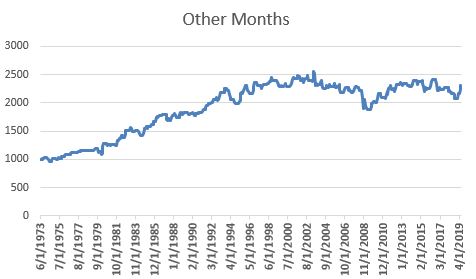
In this article I wrote about the fact that August through November is something of a “Dead Zone” for real estate stocks.  Of course, with any seasonal trend there is always the chance that “this time around” will be “the exception to the rule.”

Still let’s look at one hypothetical potential play.

The Caveat

As always, what follows is not intended to be a trade recommendation.  I don’t give advice nor make recommendations as this site is intended to be strictly “educational.”  But a working example can be helpful in illustrating what investors might consider when looking for trades to play certain situations.

The Situation

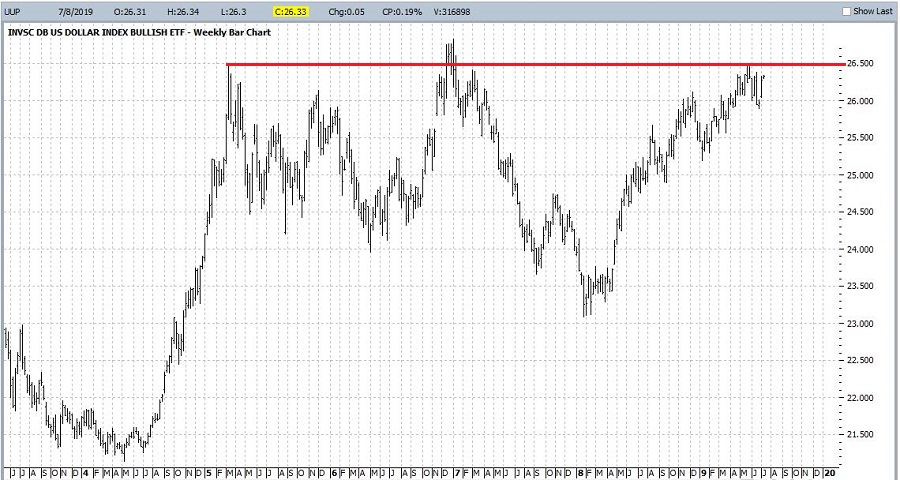
Based on a) a weak seasonal trend and, b) overhead resistance in ticker IYR, we will look for a trade that can make money as long as IYR does anything except rally strongly in the weeks ahead.

Figure 1 displays a bar char for ticker IYR.  You can see the overhead resistance for yourself.  See Figure 2 in this article for information on the unfavorable seasonal period.

1Figure 1 – Ticker IYR with the “Line in the Sand” (Courtesy AIQ TradingExpert)

So, we are looking for an opportunity to make money if IYR does NOT rally strongly prior to the end of September.  One possibility is the example trade highlighted in Figures 2and 3, which involves:

*Selling 1 IYR Oct 94 call

*Buying 1 IYR Oct 99 call

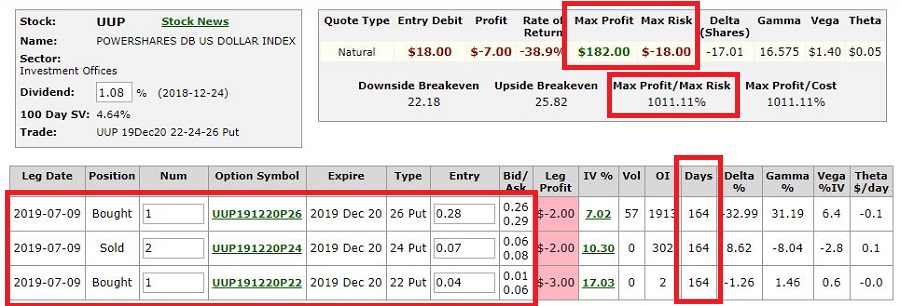
Because these options are not heavily traded one would likely want to place a limit order and try to get filled at the midpoint of the bid/ask range rather than simply placing a market order.  Figure 2 displays the particulars.2Figure 2 – IYR Bear Call Spread (Courtesy www.OptionsAnalysis.com)

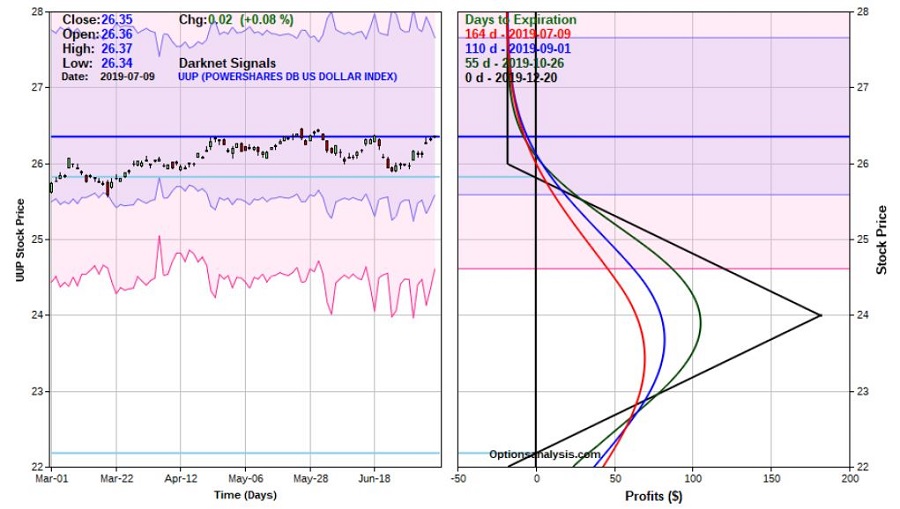
Figure 3 displays the risk curves assuming that the trade is held until expiration on October 18th.

3Figure 3 – IYR Bear Call spread risk curves (Courtesy www.OptionsAnalysis.com)

For a 1-lot:

*Maximum profit potential = $36 (13.64% of capital risked)

*Maximum risk = (-$264)

*At expiration the position will show a profit with IYR at any price below $94.36 a share

*At expiration the trade will earn the maximum profit of $36 if IYR is at $94 or below

*The maximum loss of -$264 would only occur if we held the position until expiration and IYT was at or above $99 a share at that time.  Clearly, we need a plan to make sure that that does not happen.

The Plan

Our plan is to hold this trade no longer than through the end of October.  So, to get a better idea of “where this trade lives”, we will change the risk curve chart so that the last line is drawn as of 9/30/2019 (i.e., with 18 days left until expiration.4

Figure 4 – Adjusting risk curve settings to “where this trade lives” (Courtesy www.OptionsAnalysis.com)

Likewise, this trade essentially hinges on the idea that IYR will NOT break out to the upside.  So, in terms of stop-loss it makes sense to consider a price not too far above the recent high of $91.22 a share.

In Figure 5 we see that if we use $92.50 as a stop-loss point, then if IYR were to rally immediately to that price we would exit with a loss of roughly -$56 on a 1-lot.5Figure 5 – “Zoomed in” risk curves (Courtesy www.OptionsAnalysis.com)

Another alternative would be to make the stop-loss price something above the breakeven price of $94.36.  The tradeoff in doing so is:

a) You increase the probability that the trade will NOT be stopped out

b) You increase the amount that will be lost if the stop-loss is hit (i.e., if IYR hits say $94.50, the loss could be over $100 on a 1-lot.

In a nutshell:

*a stop at $92.50 has a higher likelihood of being hit, but results in a smaller loss

*a stop-loss at $94.50 has a lower likelihood of being hit, but results in a larger loss.

There is no “right” or “wrong” choice – each trader must decide where their priorities lie.

Summary

Repeating now: I am not making any predictions regarding ticker IYR nor am I “recommending” the trade above.  The bear call spread detailed above is presented merely as an example of one way to “stack several factors” – in this case, a weak seasonal trend plus an obvious “line in the sand” as overhead resistance.

Jay Kaeppel

Disclaimer:  The data presented herein were obtained from various third-party sources.  While I believe the data to be reliable, no representation is made as to, and no responsibility, warranty or liability is accepted for the accuracy or completeness of such information.  The information, opinions and ideas expressed herein are for informational and educational purposes only and do not constitute and should not be construed as investment advice, an advertisement or offering of investment advisory services, or an offer to sell or a solicitation to buy any security.

Better Keep an Eye on Transports

In this article I wrote the fact that real estate stocks are soon to enter an “unfavorable” seasonal period.  While you’re at it, you might want to keep a close eye on transportation stocks.

Let’s take a closer look.

Favorable Period

We are going to paint with the broadest stroke possible and aver that the “seasonally” favorable period for transportation stocks is any month NOT named August or September.

Figure 1 below displays the growth of $1,000 invested in ticker FSRFX (Fidelity Select Transportation) during ALL months EXCEPT August and September starting in 1987, as well as the growth of $1,000 invested in FSRFX on a buy-and-hold basis. 1Figure 1 – Growth of $1,000 invested in ticker FSRFX during all months other than August and September (blue) versus Buy-and-Hold (red); 12/31/1986- 6/30/2019

Unfavorable Period

Figure 2 below displays the growth of $1,000 invested in ticker FSRFX (Fidelity Select Transportation) only during the months of August and September since 1987.

2Figure 2 – Growth of $1,000 invested in ticker FSRFX ONLY during August and September; 12/31/1986- 6/30/2019

Here is something important to note: Despite the fact that the August/September period has seen FSRFX lose -59%, the period has showed a gain slightly more often than a loss.  The problem is that when it loses, it tends to lose big.  To wit:

Aug/Sept in FSRFX

# times UP = 18 (56%)

# times DOWN = 14 (44%)

Average % gain = +3.3%

Average % loss = (-9.9%)

Figure 3 displays the annual August/September cumulative % +(-) since 1987.3Figure 3 – FSRFX August/September Cumulative Annual % +(-)

Figure 4 displays some more comparative data.

4Figure 4 – All Month (other than Aug/Sep) versus Aug/Sep and Buy-and-Hold; 1987-2018

Summary

So, the takeaway is pretty simple.  The takeaway is NOT that transport stocks are doomed to decline in August/September of 2019.  The takeaway IS that if trouble starts to unfold in the transports in the days and weeks ahead, “sitting and taking it” is probably not the proper response.

Jay Kaeppel

Disclaimer:  The data presented herein were obtained from various third-party sources.  While I believe the data to be reliable, no representation is made as to, and no responsibility, warranty or liability is accepted for the accuracy or completeness of such information.  The information, opinions and ideas expressed herein are for informational and educational purposes only and do not constitute and should not be construed as investment advice, an advertisement or offering of investment advisory services, or an offer to sell or a solicitation to buy any security.

Real Estate’s Favorable Period is Winding Down

I am not very good at “predicting” things.  But I am reasonably good at “observing” things. And one thing I have observed is that real estate stocks tend to perform better during late winter through mid-summer and tend to perform less well during late summer into early winter.

Let’s take a closer look.

Favorable Period

Figure 1 below displays the growth of $1,000 invested in ticker FRESX (Fidelity Select Real Estate) only during the months of March through July since fund inception in 1986.  Like most things related to the financial markets it is by no means perfect.  At the same time, it is still pretty darn good – at least in terms of consistency.

1Figure 1 – Growth of $1,000 invested in ticker FRESX ONLY suring May through July (1987-2019)

Assuming FRESX does not collapse before the end of July, 2019 will mark the 28th UP March through July period for FRESX in the past 33 years (84.8% success).

Less Favorable Period

Figure 2 below displays the growth of $1,000 invested in ticker FRESX (Fidelity Select Real Estate) only during the months of August through November since fund inception in 1986.  We cannot designate this period as “bearish” since there are obviously many years when this period shows a gain.  But that is not the point.  The point is simply that the gains are much less consistent than during the period covered in Figure 2.2Figure 2 – Growth of $1,000 invested in ticker FRESX ONLY during August  through November (1987-2018)

Summary

So how will real estate stocks perform between Aug 1 and Nov 30?  It beats me.  They may do just fine.

But the bigger picture lesson is that putting the odds in your favor can pay off big in the long run.

Jay Kaeppel

Disclaimer:  The data presented herein were obtained from various third-party sources.  While I believe the data to be reliable, no representation is made as to, and no responsibility, warranty or liability is accepted for the accuracy or completeness of such information.  The information, opinions and ideas expressed herein are for informational and educational purposes only and do not constitute and should not be construed as investment advice, an advertisement or offering of investment advisory services, or an offer to sell or a solicitation to buy any security.

The Agony and Ecstasy of Trend-Following

Let’s face it, many investors have a problem with riding a trend.  When things are going well they fret and worry about every blip in interest rates, housing starts, earnings estimates and the price of tea in China, which often keeps them from maximizing their profitability.  Alternatively, when things really do fall apart they suddenly become “long-term investors” (in this case “long-term” is defined roughly as the time between the current time and the time they “puke” their portfolio – just before the bottom).

Which reminds me to invoke:

Jay’s Trading Maxim #6: Human nature is a detriment to investment success and should be avoided as much as, well, humanly possible.

So, it can help to have a few “go to” indicators, to help one objectively tilt to the bullish or bearish side.  And we are NOT talking about “pinpoint precision timing” types of things here. Just simple, objective clues.  Like this one.

Monthly MACD

Figure 1 displays the S&P 500 index monthly chart with the monthly MACD Indicator at the bottom.1Figure 1 – Monthly S&P 500 Index with MACD (Courtesy AIQ TradingExpert)

The “trading rules” we will use are pretty simple:

*If the Monthly MACD closes a month above 0, then hold the S&P 500 Index the next month

*If the Monthly MACD closes a month below 0, then hold the Barclays Treasury Intermediate Index the next month

*We start our test on 11/30/1970.

*For the record, data for the Barclays Treasury Intermediate Index begins in January 1973 so prior to that we simply used an annual interest rate of 1% as a proxy.

Figure 2 displays the equity curves for:

*The strategy just explained (blue line)

*Buying and holding the S&P 500 Index (orange) line

2Figure 2 – Growth of $1,000 using MACD System versus Buy-and-Hold

Figure 3 displays some “Facts and Figure” regarding relative performance.

3

Figures 3 – Comparative Results

For the record:

*$1,000 invested using the “System” grew to $143,739 by 6/30/2019

*$1,000 invested using buy-and-hold grew to $102,569 by 6/30/2019

*The “System” experienced a maximum drawdown (month-end) of -23.3% and the Worst 5-year % return was +7.3% (versus a maximum drawdown of -50.9% and a Worst 5-year % return of -29.1% for Buy-and-Hold)

So, from the chart in Figure 2 and the data in Figure 3 it is “obvious” that using MACD to decide when to be in or out of the market is clearly “better” than buy-and-hold.  Right?  Here is where it “gets interesting” for a couple of reasons.

First off, the MACD Method outperforms in the long run by virtue of missing a large part of severe bear markets every now and then.  It also gets “whipsawed” more often than it “saves your sorry assets” during a big bear market.  So, in reality it requires ALOT of discipline (and self-awareness) to actually follow over time.

Consider this: if you were actually using just this one method to decide when to be in or out of the market (which is NOT what I am recommending by the way) you would have gotten out at the end of October 2018 with the S&P 500 Index at 2,711.74.  Now nine months later you would be sitting here with the S&P 500 Index flirting with 3,000 going “what the heck was I thinking about!?!?!?”  In other words, while you would have missed the December 2018 meltdown, you also would have been sitting in treasuries throughout the entire 2019 rally to date.

Like I said, human nature, it’s a pain.

To fully appreciate what makes this strategy “tick”, consider Figures 4 and 5. Figure 4 displays the growth of equity when MACD is > 0 (during these times the S&P 500 Index is held).

4

Figure 4 – Growth of $1,000 invested in S&P 500 Index when MACD > 0.

Sort of the “When things are swell, things are great” scenario.

Figure 5 displays the growth of $1,000 for both intermediate-term treasuries AND the S&P 500 Index during those times when MACD > 0.

5

Figure 5 – Growth of $1,000 invested in Intermediate-term treasuries (blue) and the S&P 500 (orange) when MACD < 0.

Essentially a “Tortoise and the Hare” type of scenario.

Summary

Simple trend-following methods – whether they involve moving average using price, trend lines drawn on charts or the MACD type of approach detailed herein – can be very useful over time.

*They can help an investor to reduce that “Is this the top?” angst and sort of force them to just go with the flowing while the flowing is good.

*They can also help an investor avoid riding a major bear market all the way to the bottom – which is a good thing both financially and emotionally.

But everything comes with a cost.  Trend-following methods will never get you in at the bottom nor out at the top, and you WILL experience whipsaws – i.e., times when you sell at one price and then are later forced to buy back at a higher price.

Consider it a “cost of doing business.”

Jay Kaeppel

Disclaimer:  The data presented herein were obtained from various third-party sources.  While I believe the data to be reliable, no representation is made as to, and no responsibility, warranty or liability is accepted for the accuracy or completeness of such information.  The information, opinions and ideas expressed herein are for informational and educational purposes only and do not constitute and should not be construed as investment advice, an advertisement or offering of investment advisory services, or an offer to sell or a solicitation to buy any security.

Treasury Bonds Meet the Election Cycle (Part II)

In this article, I wrote about the connection between long-term treasury bonds and the four-year presidential election cycle.  In this piece we will look at one way to turn that information into a trading method.

The Calendar

Figure 1 displays my own “calendar” for long-term treasuries as it relates to the 4-year cycle.

1

Figure 1 – Jay’s Election Cycle Bond Calendar

The Test

For testing purposes (though not necessarily for trading purposes) we will use:

*Ticker VWESX (Vanguard Long-Term Treasury Fund) which has data going back to 1973

*The Bloomberg Barclay’s Treasury 1-3 Index which has data starting in January 1976

We will “trade” as follows:

*During the months listed “Bonds” in Figure 1 we will hold ticker VWESX

*During all other months we will hold the Bloomberg Barclay’s Treasury 1-3 Index

*We will also track an investment using VWESX on a buy-and-hold basis as our benchmark.

In a nutshell, we will hold long-term treasuries during the “favorable” months and retreat to the relative safety of short-term treasuries during all other months.

IMPORTANT NOTE: For actual trading purposes ticker VWESX is likely NOT a viable candidate as Vanguard has certain switching restrictions which may limit the ability of a trader to move in and out as often as dictated by the schedule in Figure 1.  An alternative fund might be long-term treasury funds offered by ProFunds or Rydex and another viable alternative might be the ETF ticker TLT – the iShares ETF that track’s long-term treasuries.  On the short-term side one alternative is ticker SHY – an ETF that tracks short-term treasuries.

The Results

Figure 2 displays the cumulative growth of $1,000 invested using the rules above (blue line) versus buying and holding VWESX (red line) starting in January 1976.

3

Figure 2 – Growth of $1,000 using the Election Cycle strategy versus buying-and-holding VWESX

Figure 3 displays the relative performance figures.

2

Figure 2 – Election Cycle Strategy versus Buy/Hold

In a nutshell, the Strategy generated more profit with less volatility and risk than simply buying-and-holding long-term treasuries.

Summary

So, is the strategy detailed above a viable approach to investing?  That’s up to the reader to decide.  There are many potential caveats, including the fact that there is no guarantee that anybody’s “seasonal calendar” will prove accurate ad infinitum into the future.  Also, the past four decades have been very favorable for bonds overall.  If and when interest rates actually rise once again, profits in bonds may be harder to come by.

Jay Kaeppel

Disclaimer:  The data presented herein were obtained from various third-party sources.  While I believe the data to be reliable, no representation is made as to, and no responsibility, warranty or liability is accepted for the accuracy or completeness of such information.  The information, opinions and ideas expressed herein are for informational and educational purposes only and do not constitute and should not be construed as investment advice, an advertisement or offering of investment advisory services, or an offer to sell or a solicitation to buy any security.

Treasury Bonds Meet the Election Cycle

Many traders are aware of the connection between the stock market and the 4-year presidential election cycle.  Not many are aware of the connection between long-term treasury bonds and the same election cycle.

The Calendar

Figure 1 displays my own “calendar” for long-term treasuries as it relates to the 4-year cycle.

1

Figure 1 – Jay’s Election Cycle Bond Calendar

So how do bonds perform relative to this calendar?

The Test

For testing purposes (though not necessarily for trading purposes) we will use ticker VWESX (Vanguard Long-Term Treasury Fund) which has data going back to 1973.  For testing purposes, we will refer to those months labeled “”Bonds” in Figure 1 as “Good Months” and all other months as “Other Months.”

Figure 2 displays the relative performance between “Good Months” and “Other Months”.

2

Figure 2 – Good Months versus Other Months

Notes:

*The “average” Good Month gained four times the “average” Other Month

*The “median” Good Month gained over three times the “median” Other Month

*Good Months had a slightly lower standard deviation than Other Months

*In 242 “Good Months” since 1973 VWESX gained +1,620%

*In 309 “Other Months” since 1973 VWESX gained +131%

Figure 3 displays the cumulative growth of $1,000 invested in VWESX ONLY during “Good Months”.

3

Figure 3 – Growth of $1,000 in VWESX ONLY during Good Months

Figure 4 displays the cumulative growth of $1,000 invested in VWESX ONLY during “Other Months”.

4

Figure 4 – Growth of $1,000 in VWESX ONLY during Other Months

Summary

Is any of this actually useful?  Hey, I just report what I see, you take it from there.

In Part II we will look at an actual trading application.

Jay Kaeppel

Disclaimer:  The data presented herein were obtained from various third-party sources.  While I believe the data to be reliable, no representation is made as to, and no responsibility, warranty or liability is accepted for the accuracy or completeness of such information.  The information, opinions and ideas expressed herein are for informational and educational purposes only and do not constitute and should not be construed as investment advice, an advertisement or offering of investment advisory services, or an offer to sell or a solicitation to buy any security.

A Bet Against the Buck

Speculation comes down to a (seemingly) simple two-step process:

Step 1. Spot opportunity

Step 2. Exploit opportunity

Sure, there are a lot of potential “details” built into those two steps.  And there are other ancillary considerations, like for example, “don’t lose your shirt” in the process.  And then of course there is the fascination with “predictions”.  While “spotting opportunity” and “making a prediction” may seem like the same thing, in reality they are not.

Making a prediction means discerning today what will happen tomorrow (or on some subsequent day after that).  Predictions also tend to involve a fair amount of “ego.”  “I think [your prediction here]” pretty much puts your ego on the line.  If your prediction fails to pan out you can and typically do look and feel kind of stupid.

“Spotting opportunity” simply means you believe that there is a chance that things may go a certain way and wanting to take advantage of that occurrence should it pan out.  “Exploiting opportunity” simply means figuring out a way to give yourself, a) a chance to make good money if things work out, while ALSO, b) taking steps to limit the amount of risk you expose yourself to since – let’s be brutally candid here – any trade you might enter has a chance of failing.

Spotting Opportunity: The U.S. Dollar

Take for instance, the U.S. Dollar.  I have no real mechanism for “predicting” what will happen next to the dollar.  I do know that it has been in a pretty strong uptrend since January of 2018.  So on one hand, as a pretty avid “trend-follower”, I would normally be looking at the bullish side of things for an opportunity.  However, I also know that:

a) it is looking at a significant resistance level at slightly higher prices, and

b) it is about to enter its seasonally unfavorable time of year.

So, have I spotted an opportunity?  Well, that the other thing about opportunity.  Each potential one is “in the eye of the beholder.”

In Figure 1 we see that ticker UUP – an ETF that tracks the U.S. Dollar versus a basket of foreign currencies has an obvious resistance level that it needs to take out in order to remain in an established uptrend.  Will it do so?  The truth is I haven’t the slightest idea.2Figure 1 – Ticker UUP with overhead resistance (Courtesy ProfitSource by HUBB)

In Figure 2 we see the annual seasonal trend for U.S. Dollar futures courtesy of www.Sentimentader.com.  As you can see we are about to enter the “typical” period of weakness.

1Figure 2 – Annual seasonal trend for U.S. Dollar (Courtesy Sentimentrader.com)

Figure 3 displays trade sentiment for the U.S. Dollar (also from www.Sentimentrader.com).  Note that it recently exceeded the horizontal red line that I drew in the range of about 75% or so.  Note the action of the dollar following previous readings in this area.3Figure 3 – Trader optimism for the U.S. Dollar (Courtesy Sentimentrader.com)

Does any of this guarantee that the dollar – and ticker UUP – are going to decline anytime soon.  Not at all.  But it does highlight a potential opportunity.  The next question then is, “is there a way to exploit this potential opportunity that gives us good profit potential without a lot of risk?”

Exploiting Opportunity using options on UUP

Figures 4 and 5 display the particulars and risk curves for an “out-of-the-money put butterfly” spread (OTM put fly for short) using put options on UUP.

4Figure 4 – OTM butterfly using UUP put options (Courtesy www.OptionsAnalysis.com)

5Figure 5 – Risk curves for OTM butterfly using UUP put options (Courtesy www.OptionsAnalysis.com)

A few things to note:

*This trade is using December options which are NOT very actively traded.  Still, via the use of a limit order this trade might be able to be entered for a cost of just $18 for a 1 by 2 by 1 butterfly spread.

*In addition to a low dollar risk the position also has plenty of profit potential and roughly 5 months of time for things to pan out.

*From a risk management position, a trader must decide what they will do if price does breakout to the upside.  The most obvious choices are, a) exit the trade and cut one’s loss, or b) due to the low initial dollar risk, just let it ride for awhile and see if there is a failure after the breakout.

*On the profit side, I have no reason to believe that UUP will decline sharply in the months ahead.  However, it does, I also know that this trade will make a large percentage return.  If UUP drops to its March low of $25.56 a share, the trade will likely show an open profit in the $14 to $38 range depending on how soon that price is reached.

Summary

As always, I don’t make “recommendations” and the trade highlighted here is intended to serve only as an example of a way to spot opportunity and to exploit said opportunity.  So note what is and is not happening here:

I am not shouting (i.e., predicting) that “the dollar is headed lower!”  I am merely noting that if a person is willing to risk $18 (per a 1 x 2 x 1-lot) on the possibility that it might be, there is a way to do it.

Jay Kaeppel

Disclaimer:  The data presented herein were obtained from various third-party sources.  While I believe the data to be reliable, no representation is made as to, and no responsibility, warranty or liability is accepted for the accuracy or completeness of such information.  The information, opinions and ideas expressed herein are for informational and educational purposes only and do not constitute and should not be construed as investment advice, an advertisement or offering of investment advisory services, or an offer to sell or a solicitation to buy any security.

Happy Holiday Day(s)

Human nature sure is a weird thing.  There is nothing like the prospect of a “day off” to lift the spirits.  And for us working stiffs one thing we count on are “Holidays”.  And in the immortal words of Jim Lang, “Heeeere they are”:

*New Year’s Day

*Martin Luther King Day

*President’s Day

*Good Friday

*Memorial Day

*July 4th

*Labor Day

*Thanksgiving

*Christmas

For the record, holidays have changed a bit over the years.  Martin Luther King Day is relatively new as is President’s Day (which replaced Lincoln’s Birthday and Washington’s Birthday).  But the idea is the same.  There seems to be a “sense of euphoria” among investors around holidays.

The Test

Much has been written about stock market behavior around holidays.  Certain days are better than others.  But for our purposes we will keep it simple and uniform:  We will look at price performance of the Dow Jones Industrial Average during:

*the 3 trading days before and

*the 3 trading days after each holiday

Our test will start at the close on 12/31/1948.

The Results

Figure 1 displays the growth of $1,000 invested in the Dow ONLY during the 3 days before and the 3 days after every stock market holidays since 12/21/1948.

1

Figure 1 – Growth of $1,000 in Dow Industrials 3 days before and 3 days after each holiday; 12/31/1948-7/1/2019

As you can see:

*Holiday days are no sure thing

*Holidays days display a clearly bullish long-term trend

A few facts and figures:2

Figure 2 – Facts and Figures; Holiday Days versus all other trading days

As you can see:

*Holiday days have displayed roughly a 6% higher likelihood of being profitable (54.9% versus 51.8%) than all other trading days

*Holiday days have generated an average daily return (+0.0847%) that is roughly 4.2 times greater than the average daily return (+0.0203%) for all other trading days.

Summary

The bottom line is that “Yes”, the stock market does tend to perform better around stock market holidays.  Given this incontrovertiable evidence I think our course of action is clear:

We MUST contact our elected representatives and DEMAND MORE HOLIDAYS!!!

Speaking of which….Happy 4th of July.

Jay Kaeppel

Disclaimer:  The data presented herein were obtained from various third-party sources.  While I believe the data to be reliable, no representation is made as to, and no responsibility, warranty or liability is accepted for the accuracy or completeness of such information.  The information, opinions and ideas expressed herein are for informational and educational purposes only and do not constitute and should not be construed as investment advice, an advertisement or offering of investment advisory services, or an offer to sell or a solicitation to buy any security.