Monthly Archives: December 2014

The Truth about the Year-End Stock Market Rally

Yes, it really is “the most wonderful time of the year” – at least in the stock market.  But not always.  But usually.  In my book “Seasonal Stock Market Trends” (which may well be the gift that the trading loved one in your life secretly desires but is too shy to ask for, hint, hint) I wrote about “Holidays.” Starting with works from Hirsch, Fosback, Zweig, Eliades and whoever else I could think of to steal, er, borrow from, I looked at the performance for the stock market on each of the three days before and after a market holiday.

While I personally found the results to be interesting, it strikes me as curve-fitting to say something like “you should be long the stock market the second trading day before Christmas, the day after Thanksgiving , the second trading day after the 4th if July”, etc.  Instead I prefer to look at “holiday trading season” as the three trading days before and the three trading days after a market holiday, in totality.  So this week let’s look at the three trading days before Christmas through the three trading days after New Year’s period.

The Year-End Seasonal Pattern

To define things, we are looking specifically at the period that:

*Starts at the close of trading four trading days before Christmas (in this case, Friday, Dec. 19th, 2014)

*Ends at the close of trading on the third trading day of January (i.e., the third trading day after New Years, in this case, Tuesday, Jan. 6, 2015)

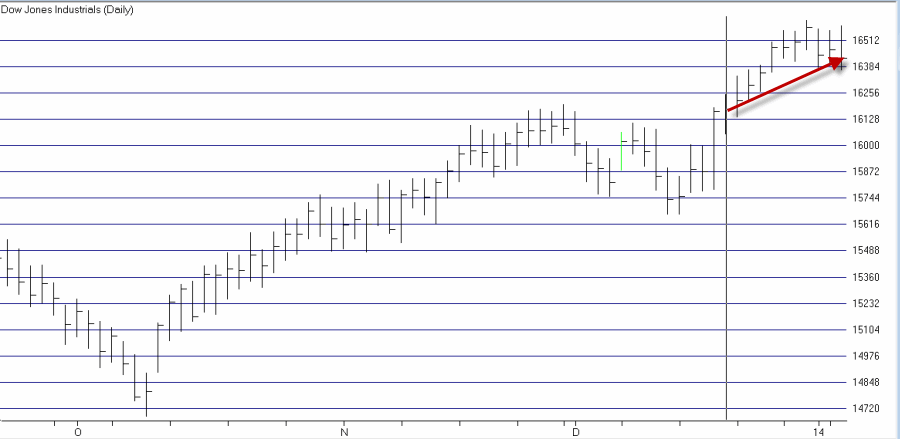
This period during the 2013-2014 year-end period is highlighted in Figure 1.DJIA year end Figure 1 – Bullish Year-End Period 2013-2014 (Courtesy: AIQ TradingExpert)
The Results

To get a true sense of the bullish bias during this period, Figure 2 displays the growth of $1,000 invested in the Dow Industrials ONLY during this “bullish year-end” period starting in December 1933.DJ Year EndFigure 2- Growth of $1,000 invest in Dow only during bullish year-end period
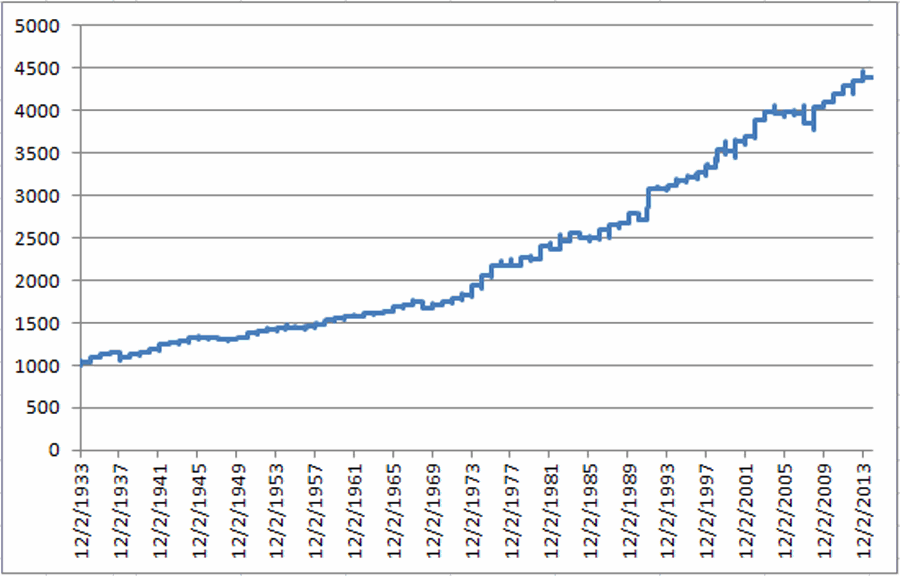
The annual results using the Dow Jones Industrial Average appear in Figure 2.

Period End Date DJIA %+(-)
01/04/34 3.67
01/04/35 5.12
01/04/36 3.28
01/05/37 1.83
01/05/38 (4.09)
01/05/39 2.41
01/04/40 2.21
01/04/41 2.74
01/05/42 5.95
01/05/43 0.88
01/05/44 2.05
01/04/45 2.54
01/04/46 0.15
01/04/47 (0.52)
01/06/48 (1.07)
01/05/49 0.41
01/05/50 1.70
01/04/51 4.03
01/04/52 1.34
01/06/53 1.98
01/06/54 0.34
01/05/55 (0.02)
01/05/56 0.45
01/04/57 0.63
01/06/58 2.62
01/06/59 3.18
01/06/60 0.99
01/05/61 1.28
01/04/62 0.02
01/04/63 2.35
01/06/64 0.74
01/06/65 1.14
01/05/66 3.09
01/05/67 1.37
01/04/68 2.05
01/06/69 (3.95)
01/06/70 1.75
01/06/71 2.00
01/05/72 2.19
01/04/73 3.04
01/04/74 6.11
01/06/75 5.42
01/06/76 5.50
01/05/77 0.58
01/05/78 (0.16)
01/04/79 4.59
01/04/80 (1.20)
01/06/81 7.20
01/06/82 (1.38)
01/05/83 4.02
01/05/84 3.24
01/04/85 (1.91)
01/06/86 0.24
01/06/87 3.24
01/06/88 2.38
01/05/89 1.13
01/04/90 3.73
01/04/91 (2.31)
01/06/92 13.41
01/06/93 (0.22)
01/05/94 1.16
01/05/95 2.22
01/04/96 1.25
01/06/97 1.44
01/06/98 1.93
01/06/99 6.19
01/05/00 (0.19)
01/04/01 3.10
01/04/02 1.88
01/06/03 4.89
01/06/04 2.53
01/05/05 (0.60)
01/05/06 0.71
01/05/07 (0.59)
01/04/08 (3.08)
01/06/09 5.08
01/06/10 1.53
01/05/11 2.13
01/05/12 2.58
01/04/13 1.38
01/06/14 0.87
Average 1.88
Median 1.83
Maximum % 13.41
Minimum % (4.09)
# Times Up 66.00
# Times Down 15.00
% Times Up 81.48
% Times Down 18.52

Figure 2 – Year-by-Year Results; Year-End Rally

As you can see in Figure 2, there is some good news and some bad news, but mostly good news. To wit:

*This period has showed a gain 81.5% of the time.

*This period is in no way “guaranteed” to result in a profit as it has showed a loss 18.5% of the time

*The largest up period was +13.41% (1991-1992)

* The largest down period was -4.09% (1937-1938)

*The “average winning trade” and “median winning trade” was +2.62% and +2.16%, respectively.

*The “average losing trade” and “median losing trade” was (-1.42%) and (-1.07%), respectively.

Summary

So is the stock market “sure to rally” between now and 1/6/15? Of course not.  Nevertheless, the results displayed above suggest that traders are typically wise to give the bullish case the benefit of the doubt during the Christmas/New Year’s Holiday Seasonal.

Wishing all JayOnTheMarkets.com readers a “Very Merry Christmas and a Happy New Year” (unless of course, you are offended by this, in which case, wishing you “Whatever”.)

Jay Kaeppel
If You Just Have to Pick a Bottom in Crude Oil…

OK, let’s be candid about this title.  The reality is that no one ever “has to pick a bottom.”  In fact, we are advised time and again to avoid this very activity as it is considered to be “dangerous”, “foolhardy” and/or “unlikely to succeed”, depending on the person dispensing the wisdom.

Still, if you are reading this article then chances are you are doing so because at some point in your (checkered?) trading past you have either been tempted to “pick a bottom (and/or top)” or you have actually tried to do so.  So you know deep down that it is probably not a very good idea.  Still, it sure is tempting isn’t it?  I mean let’s be honest here.  Who doesn’t want to be able to say they “picked the bottom” in, well, something, whatever. And you sure can make a lot of money if you get in at exactly the right moment.

So let’s dispense with niceties and conventional wisdom and acknowledge the fact that we are in fact imperfect beings, complete with foibles, faults, bad habits and extremely subject to human nature (and isn’t that a pain in the rear).  So if you consider yourself to be a “trader” it may be hard to look at the recent freefall in oil and perhaps gold prices and not say “Man, this thing is due to bounce.  I wonder if there is a way to play this?”  So let’s take a look at one way to play a potential bounce in crude oil.

A Few Important Caveats

1) I haven’t the slightest idea if crude oil will bounce soon or not.  In fact, if my gut told me that it was then my first reaction would likely be to ignore it (but enough about my own personal psychoses’).

2) Regardless of whatever the rest of this article says the cold hard reality is that this exact moment in time is probably not the moment that crude oil will bottom out.  In fact, it could continue to fall precipitously for some time to come.

3) Yes, trying to pick a bottom in anything is in fact analogous to attempting to catch a falling knife. It’s a really cool trick if it works, but it can get a little messy otherwise.

So I am NOT “predicting” that crude is about to bounce and I am NOT recommending that you take the trade I will discuss in a moment.

So what is the point?  The point is this: There is a right way and a wrong way to do everything, no matter how wise or foolish the current “thing” in question may be.  If you are going to pick a bottom then you want to do two things:

1) Understand going in that you are playing a long shot so prepare yourself mentally in advance to fail (in fact you might even want to go ahead and prepare yourself to kick yourself and say “What the heck was I thinking about?”).

2) Do everything possible to minimize your risk based on current circumstances.

One Way to Play a Bounce in Crude

OK, all caveats out of the way, let’s now go ahead and “take the plunge.”  A few key factors:

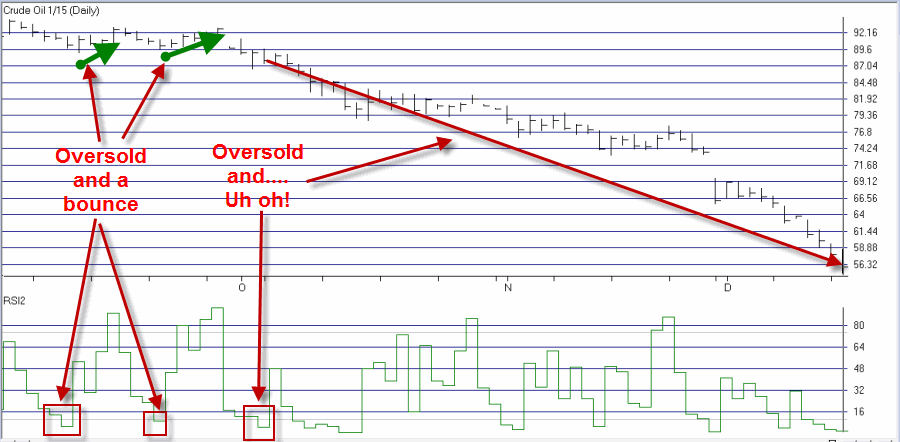
1) My own personal opinion is that any trade that attempts to pick a top or bottom should involve the use of options.  Why?  Simple – limited risk.  To better appreciate this, imagine the poor schlub who bought a January 2015 crude oil futures contract on 10/3 when the 2-day RSI (which I like by the way) dropped below 5, thus strongly suggesting that crude oil was “oversold”.  As you can see in Figure 1, since that time, Jan2015 CL has fallen from 87.87 to 55.91. At $1,000 a point, that works out to a loss of -$32,900 per contract.  Ouch.  And thanks for playing our game.cl f1

Figure 1 – “Oversold” Crude Oil not such a Bargain (Courtesy: AIQ TradingExpert)

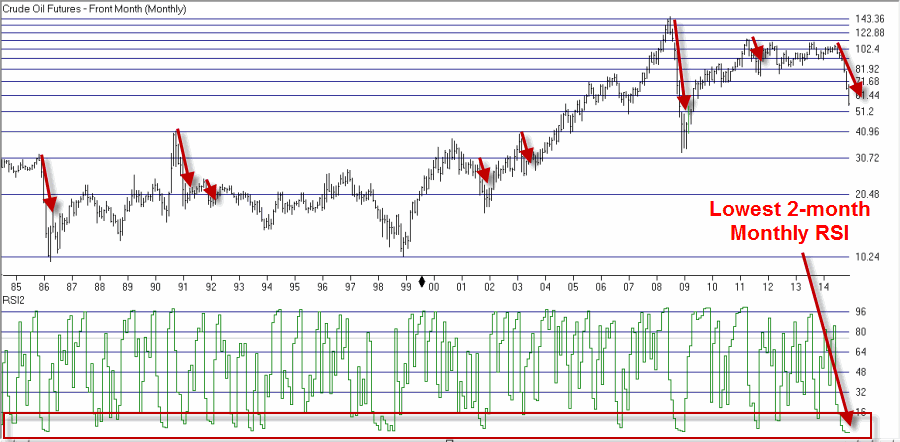
2) The current “waterfall” decline in crude is not without precedent.  In Figure 2 – which displays a continuation chart of crude oil futures – you can see several occasions when the bottom dropped out of crude oil, so to speak.  In the past these types of declines have typically lasted 3 to 8 months.  The current decline is in its 6 month. Likewise, as of 12/16, the monthly 2-month RSI was at its lowest reading in 30+ years of trading.  The point here is not to argue that a reversal is imminent, only that it isn’t entirely crazy to think that a bounce is possible.cl f2Figure 2 – Crude Oil “waterfall declines” past and present (Courtesy: AIQ TradingExpert)

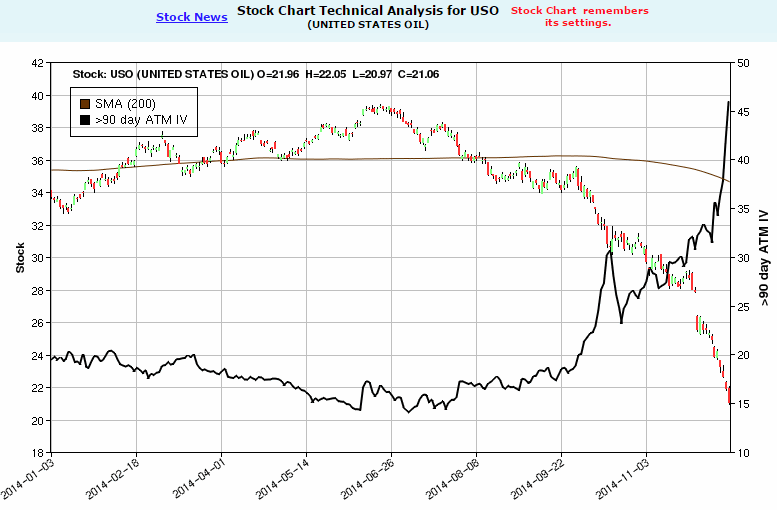
The least expensive way to play a potential bounce in crude oil is via options on ticker USO, the ETF that tracks (more or less) the price of crude oil.  In Figure 3 you see the USO bar chart with the 90+ day implied option volatility plotted.

cl f3Figure 3 – Implied Volatility for USO options has “spiked” (Courtesy: www.OptionsAnalysis.com)

IV has spiked to its highest level in years.  This has important implications for option traders. High implied volatility simply tells us that there is a lot of time premium built into the price of USO options.  As a result, traditional bullish strategies such as buying calls or bull call spreads may be poor choices for someone looking to play a bounce.  This is because implied volatility typically (albeit not always) declines when a security bounces higher off of a panic selling bottom.  Selling a bull put spread might make sense as an alternative.  However, I personally don’t advocate that strategy in the face of an ongoing waterfall decline.  A bull put spread is best used when there is some sort of support level that a trader can use as an “uncle” point.

So what to do?

What to Do

Well as I stated earlier, for the vast majority of traders the best course is to “do nothing” and NOT attempt to pick a bottom in crude.  However, we are talking about what actions a trader might consider if he or she has decided to “take a flyer”.  So here is one possibility – a “Reverse Call Calendar Spread.”

As long as we are breaking all the rules I think it is OK to point out that a reverse calendar spread is a strategy that most traders will never use, and in most cases should never use.  But every tool has its use.  What we are looking for in this case is:

1) Price movement between now and the first week of February, and;

2) A decline in implied volatility

So one way to play is:

*Buy 1 Feb 2015 21 Call @ 1.46

*Sell 1 Mar 2015 21 Call @ 1.77

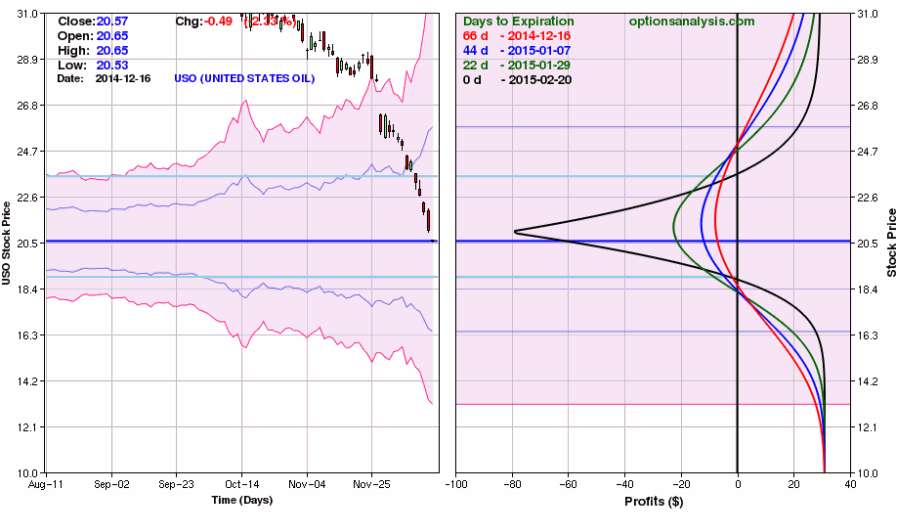
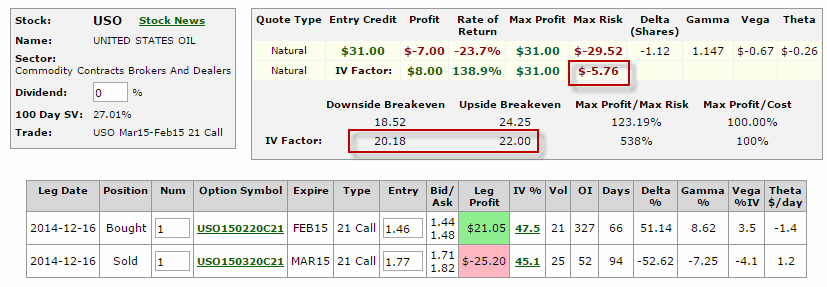
The prospects for this trade appear in Figures 4 and 5.cl f4Figure 4 – Reverse call calendar spread for USO (Courtesy: www.OptionsAnalysis.com)cl f5Figure 5 – Reverse call calendar spread for USO (Courtesy: www.OptionsAnalysis.com)

A few key things to note for starters:

1) Assuming this trade is held until February expiration and implied volatility remains unchanged this trade (based on a 1-lot) has $31 of profit potential and $80 of risk.

2) “Vega” represents the amount that the trade will gain or lose if implied volatility rises by 1 percentage point.  This trade has a Vega of $-0.67.  This means that if volatility keeps rising lose potential may also increase.  However, if IV falls the profit potential for this trade will increase.  If IV falls 10 percentage points the profit on this trade will increase (roughly) $6.70.

3) Implied volatility for the options in this trade are extremely high (45% or more) on a historical basis.

4) From a risk management perspective the most important thing to note is that this trade should NOT be held until February option expiration.  By planning to be out no later than two weeks prior to expiration (i.e., by Feb. 6) we completely eliminate that potential of experiencing the maximum potential loss, and in fact reduce the worst case scenario significantly.

Let’s make the following assumptions to highlight exactly what this trade is designed to achieve.  The information in Figures 6 and 7 assume:

1) That the trade will be held no later than Feb. 6, and;

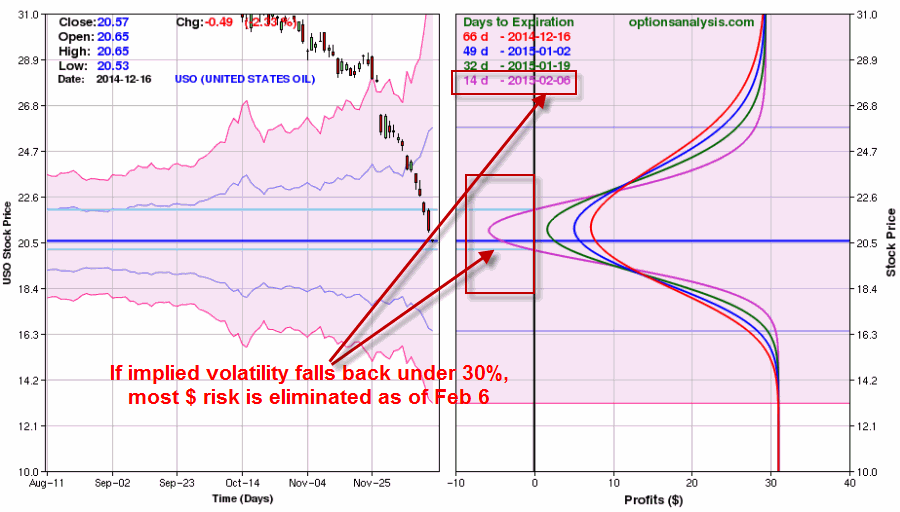
2) That implied volatility falls 40% from current level (i.e., current IV x 0.6)

In Figures 6 and 7 you clearly see the potentially positive implications for a meaningful decline in implied volatility.cl f6Figure 6 – USO reverse calendar if IV declines back under 30% (Courtesy: www.OptionsAnalysis.com)cl f8Figure 7 – USO reverse calendar if IV declines back under 30% (Courtesy: www.OptionsAnalysis.com)

In this scenario, the maximum risk declines to roughly -$5 on 1-lot and the break-even range is greatly compressed thus significantly raising the probability of a profitable trade.

Summary

So all in all, it is typically a bad idea to try to pick a top or bottom in the financial markets.  But all of us are human, and human nature can occasionally lead a trader to “feel the urge.”  If the urge is too great and you feel you must act, then remember to do everything in your power to limit your risk.

If your bottom picking trade works out, great (but don’t let it go to your head).  And if it does not, then at least you didn’t “bet the ranch.”

Jay Kaeppel

Seasonal E-mini Strategy – 42 Wins and 0 Losses?

Don’t you just hate titles like this one?  I mean if you are into the stock market you almost can’t help but to click on it – even if for no other reason than to seek the answer to that age old question, “What’s the catch?”

Now in this case the title is accurate, at least in the hypothetical sense.  But as you probably know, for any book, article or publication the name is everything.  For example, if the title of this article were “Would You Be Willing to Risk $3,000 on a Trade for the Chance of Making as Little as $25 on Said Trade?” (which would also be hypothetically accurate), you would be a lot less likely to click on the link, right?  I mean let’s be honest here.

So, yes, technically you can’t judge a book (article or publication) by its cover.  But in reality, we all do it all the time.  So just remember that  the people designing the covers have a vested interest in getting you to open the cover, so be forewarned.

Hence the title of this article.  But since you’ve already “cracked open the cover”, why not read on a little further?  (Insidious, no?)

A Seasonal Oversold “Idea”

Note the use of the word “Idea” in the section title.  And also please remember that the word “idea” is quite different from the words “sure” and/or “thing” and way different from the phrase “you can’t lose.”  So again, be forewarned.  In the interest of full disclosure I am not attempting to urge you to use the “idea” spelled out below – only to be “aware” of it and to consider whether or not it might “fit your style.”

So what’s this all about?  Simple.  Awhile back I wrote a piece titled “Happy Days are Here, Um, Next Monday?” that in a nutshell highlighted the fact that the stock market tends to perform well between the close of trading on the Friday before Thanksgiving and the close of the third trading day of the following January.  The “idea” in this article builds from that trend.

Entry Rules

Here are the “rules” (to paraphrase the immortal words of Bill Murray, they are really “guidelines” more than “rules”, but here goes):

*If today is between (and including) the Friday before Thanksgiving and the third trading day of the New Year, AND;

*The 2-day RSI is below 30, a “buy alert” is signaled.

*After a “buy alert” occurs, a “buy signal” occurs when the E-mini S&P 500 exceeds a previous day’s high price (however, a “buy signal” cannot occur after the third trading day of January).

Exit Rules (OK, again – Guidelines):

*Sell if the E-mini S&P declines 60 (i.e., $3,000 per contract) points from the buy trigger price (i.e., the previous day’s high + 0.25 points), OR

*On the first profitable close.

Results

Starting in November 2004 there have been 42 trades.  During this time there have been no post buy declines of 60 points (although a few have come close), hence the reason no losing trades.

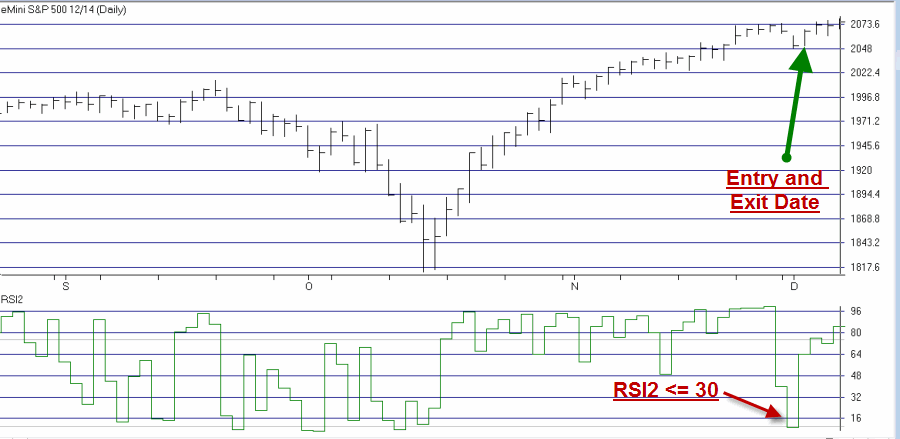
Figure 1 displays the most recent signal using the December 2014 E-mini S&P 500 contract.

es-ss 1 Figure 1 – Seasonal Oversold Trade for 2014-2015 (so far); Source: AIQ TradingExpert

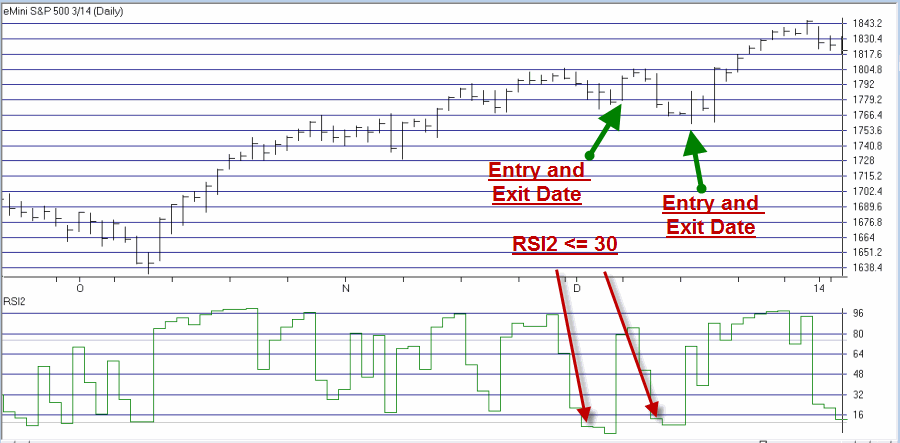
Figure 2 displays the trades from the 2013-2014 periods. es-ss2Figure 2 – Seasonal Oversold Trade for 2013-2014 (Source: AIQ TradingExpert)

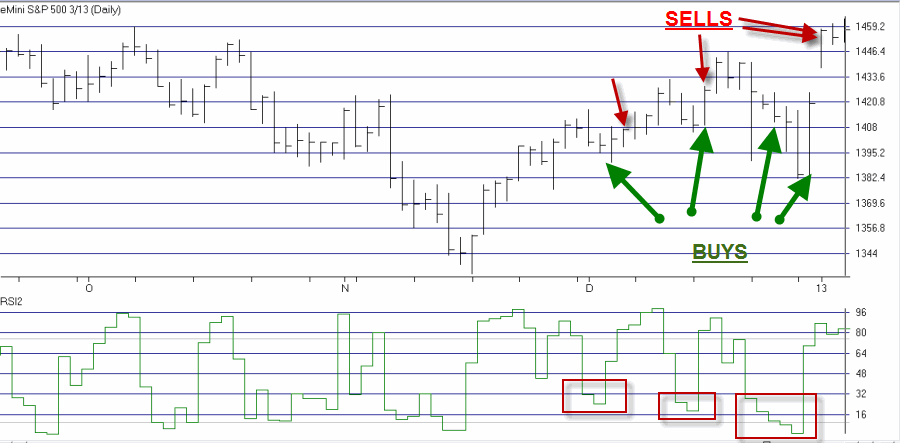
Figure 3 displays the trades from the 2012-2013 periods.

es-ss3

Figure 3 – Seasonal Oversold Trade for 2012-2013 (Source: AIQ TradingExpert)

Figure 4 displays the trades signaled each year during the bullish seasonal period (assuming a 1-lot per trade).

Trade # Entry Date Exit Date Buy Price Sell Price Points +(-) per Trade $ +(-) per Trade MaxDD Pts. per Trade MaxDD $ per Trade
1 11/23/04 11/24/04 1179.25 1182.00 2.75 $137.50 (7.75) ($388)
2 12/01/04 12/01/04 1179.75 1189.75 10.00 $500.00 (4.75) ($238)
3 12/09/04 12/09/04 1187.00 1190.75 3.75 $187.50 (11.25) ($563)
4 12/20/04 12/21/14 1203.75 1208.00 4.25 $212.50 (8.50) ($425)
5 12/01/05 12/01/05 1263.25 1264.50 1.25 $62.50 (11.50) ($575)
6 12/12/05 12/13/05 1272.75 1277.00 4.25 $212.50 (9.00) ($450)
7 12/21/05 12/22/05 1272.25 1275.50 3.25 $162.50 (5.50) ($275)
8 01/03/06 01/03/06 1259.25 1274.75 15.50 $775.00 (7.75) ($388)
9 11/29/06 11/29/06 1392.75 1402.25 9.50 $475.00 (0.50) ($25)
10 12/11/06 12/14/07 1428.00 1438.25 10.25 $512.50 (11.00) ($550)
11 12/27/06 12/27/06 1431.25 1437.00 5.75 $287.50 (0.25) ($13)
12 11/23/07 11/28/07 1440.00 1442.00 2.00 $100.00 (33.25) ($1,663)
13 11/26/07 11/28/07 1444.25 1470.50 26.25 $1,312.50 (37.50) ($1,875)
14 11/28/07 11/28/07 1441.25 1470.50 29.25 $1,462.50 (0.25) ($13)
15 12/05/07 12/05/07 1478.00 1487.00 9.00 $450.00 (1.25) ($63)
16 12/19/07 12/20/07 1471.75 1474.75 3.00 $150.00 (16.00) ($800)
17 11/24/08 11/24/08 814.50 848.00 33.50 $1,675.00 (7.25) ($363)
18 12/03/08 12/03/08 851.00 868.50 17.50 $875.00 (24.75) ($1,238)
19 12/16/08 12/16/08 885.50 912.75 27.25 $1,362.50 (9.75) ($488)
20 12/26/08 12/29/08 870.00 870.50 0.50 $25.00 (16.75) ($838)
21 11/23/09 11/23/09 1102.50 1103.75 1.25 $62.50 (1.25) ($63)
22 12/01/09 12/01/09 1104.75 1108.50 3.75 $187.50 (2.50) ($125)
23 12/04/09 12/22/09 1112.25 1113.50 1.25 $62.50 (3.75) ($188)
24 12/10/09 12/11/09 1097.75 1103.25 5.50 $275.00 (5.25) ($263)
25 12/21/09 12/22/09 1107.75 1108.25 0.50 $25.00 (11.25) ($563)
26 01/04/10 01/04/10 1124.25 1128.75 4.50 $225.00 (4.75) ($238)
27 11/24/10 12/01/10 1187.75 1196.50 8.75 $437.50 (11.50) ($575)
28 12/01/10 12/01/10 1197.50 1204.50 7.00 $350.00 (0.50) ($25)
29 12/16/10 12/21/10 1244.50 1250.75 6.25 $312.50 (12.00) ($600)
30 01/03/11 01/03/11 1258.50 1265.25 6.75 $337.50 (3.25) ($163)
31 11/28/11 11/28/11 1174.50 1191.00 16.50 $825.00 (5.25) ($263)
32 12/09/11 12/09/11 1250.50 1253.00 2.50 $125.00 (17.75) ($888)
33 12/15/11 12/20/11 1218.75 1236.00 17.25 $862.50 (23.25) ($1,163)
34 12/20/11 12/20/11 1218.75 1236.00 17.25 $862.50 (20.00) ($1,000)
35 12/30/11 01/03/12 1258.75 1272.00 13.25 $662.50 (8.00) ($400)
36 12/05/12 12/06/12 1412.00 1413.00 1.00 $50.00 (15.25) ($763)
37 12/17/12 12/17/12 1419.50 1427.00 7.50 $375.00 (10.25) ($513)
38 12/26/12 01/02/13 1424.75 1457.00 32.25 $1,612.50 (42.50) ($2,125)
39 12/31/12 12/31/12 1417.00 1420.00 3.00 $150.00 (33.50) ($1,675)
40 12/06/13 12/06/13 1794.50 1803.75 9.25 $462.50 (8.75) ($438)
41 12/16/13 12/16/13 1783.25 1786.00 2.75 $137.50 (17.75) ($888)
42 12/02/14 12/02/14 2061.25 2066.00 4.75 $237.50 (10.50) ($525)
Points $ Points $
Average 9.32 $466 (11.74) ($587)
Median 6.00 $300 (9.38) ($469)
Max 33.50 $1,675 (0.25) ($13)
Min 0.50 $25 (42.50) ($2,125)

Figure 4 – Hypothetical Trade-by-Trade Results

A few things to note:

*42 winners, 0 losers

*Maximum drawdown per 1-lot = -$2,125

*Average winner in points (dollars) = +9.32 (+$466)

*Median winner in points (dollars) = +6.00 ($300)

*Average Maximum drawdown per trade in points (dollars) = -11.74 (-$587)

*Median Maximum drawdown per trade in points (dollars) = -9.38 (-$469)

Summary

So on the face of it, anything that is capable of generating 42 consecutive winning trades would seem to have some merit to it.  On the other hand, with any trading method it is critically important to look “under the hood” and make some realistic assessments regarding the actual usefulness of said method.

The system rules include a 60 point stop-loss for the E-mini S&P 500 futures contract.  At $50 a point, this equates to a potential loss of $3,000 per contract per trade.  The average dollar profit was only $466 and the median dollar profit per trade was $300.

The key elements of risk in this method then are:

1) One losing trade of $3,000 could require a number of trades to come back from.

2) Using a tight stop-loss will result in a number of losing trades that would ultimately have ended up winners.

So the question for a trader to ask is – can we judge this book by its cover?

Jay Kaeppel

Three Sector Funds for December

December has historically been a bullish month for the stock market. In fact, over the past 24 years, buying and holding an S&P 500 Index fund during the month of December would have netted a gain 20 times, or 83.3% of the time, with an average gain of almost +2% (+1.93% actually).  A lot of investors might be tempted to say “That’s good enough for me”, and who could blame them?

But there might be a way to do even better.

Certain sectors show historical tendencies to perform well during certain times of the year.  So let’s look at a simple 3 fund portfolio that has performed quite a bit better than the S&P 500 over the past 24 years.

The “December Three”

The three sectors are Biotech, Software and Home Construction.  Figure 1 displays some potential trading vehicles.

Sector Fidelity ETF
Biotech FBIOX IBB
Software FSCSX VGT
Home Construction FSHOX XHB

Figure 1 – Fidelity and ETFs

Results

For testing purposes we will use the Fidelity funds listed in Figure 1 as they have historical data going back much further than the ETFs listed.

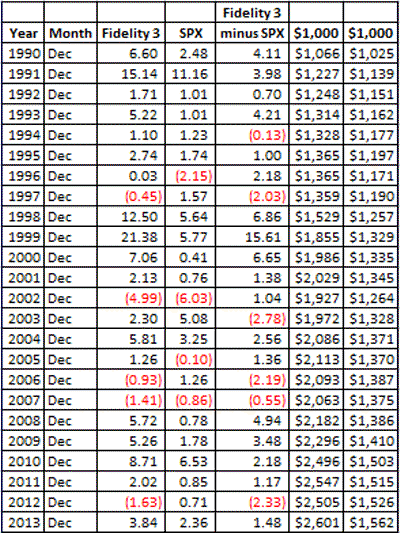
Figure 2 displays the annual result of a portfolio split evenly between the three funds versus the S&P 500 Index.

Fid 3

Figure 2 – Annual Results: 3 Fidelity Sector Funds vs. SPX

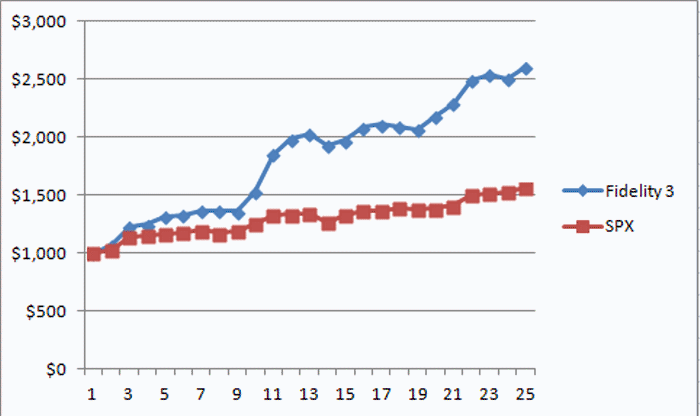
Figure 3 displays the growth of $1,000 invested only during the month of December in the “Fidelity 3” versus the S&P 500 Index. Fid 3 chartFigure 3 – Growth of $1,000 invested in Fidelity 3 versus SPX (1990-2013)

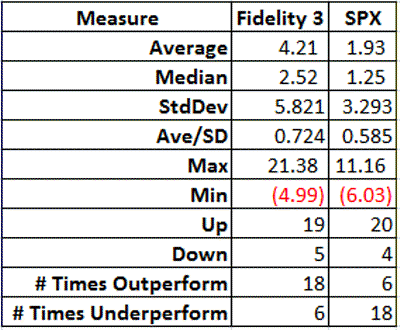
Figure 4 displays the relevant comparative figures.  fid 3 results

Figure 4 – Comparative Results

A few things to note:

*The Fidelity 3 has gained an average of +4.21% versus +1.93% for SPX.

*The Fidelity 3 median gain was +2.52% versus +1.25% for SPX.

*The Fidelity 3 has showed a higher standard deviation, but also a *higher Average/Standard Deviation.

*The worst December for the Fidelity 3 was -4.99% versus -6.03% for SPX.

*Interestingly, the Fidelity 3 has been up 19 times and down 5, versus up 20 and down 4 for SPX.  However – and most importantly – the Fidelity 3 has outperformed SPX in 18 of the past 24 years.

Summary

So are biotech, software and home construction guaranteed to show a gain and outperform the S&P 500 this December.  Not at all.

But for an investor looking to “beat the market”, it certainly is “food for thought.”

Jay Kaeppel