Monthly Archives: October 2016

4th Quarter Trends I Have Known and Loved

The fourth quarter of the year has a history of being bullish for the stock market (although, sadly, there are no guarantees). Certain sectors have shown a very persistent bullish trend within the 4th quarter.  So let’s highlight a few examples.

See also Down the Oil Well One More Time

 5 Sector Trends of Note

 We will focus on 5 Fidelity Select Sector funds (although Rydex funds, Profunds and/or ETFs can be used as an alternative). All 5 sectors highlighted in Figure 1 begin a favorable seasonal period on the close of October Trading Day #19 (10/27/2016 this year).


Sector


Start Month

Start (close of) Trading Day #…  

End Month

End (close of Trading Day #
FCYIX October 19 December 3
FSCGX October 19 January 6
FSCPX October 19 December 22
FSHOX October 19 January 1
FSPHX October 19 December 6

Figure 1 – Seasonally Favorable Sectors

The year-by-year results for each Sector/Time Period combination appears in Figure 2.

Year FCYIX FSCGX FSCPX FSHOX FSPHX
1989 0.5 4.8
1990 16.0 9.1
1991 7.6 2.7
1992 3.2 10.1 11.0
1993 7.7 3.1 6.4 1.6
1994 9.3 (1.3) (1.7) 1.8
1995 (0.7) 6.5 12.8 6.1
1996 3.5 1.1 (0.5) 4.6
1997 11.3 12.9 3.3 8.7
1998 (4.4) 16.4 17.9 8.8
1999 4.3 13.8 13.1 8.7 0.1
2000 10.3 11.2 5.4 18.7 1.0
2001 10.9 (0.2) 6.9 17.6 (0.9)
2002 3.9 5.4 (5.1) 5.5 (1.2)
2003 7.6 13.8 4.9 4.9 3.9
2004 9.1 4.4 9.8 14.9 4.6
2005 10.2 19.3 7.9 14.3 7.9
2006 2.0 6.8 (1.6) 6.4 (0.8)
2007 (2.0) 16.1 (8.1) (10.1) 2.0
2008 6.1 4.3 14.8 32.5 4.7
2009 5.9 (6.6) 8.0 7.9 3.6
2010 7.6 14.3 8.8 17.3 4.9
2011 (1.4) 14.2 (3.8) 5.3 (2.6)
2012 3.1 15.3 2.8 8.8 1.0
2013 1.6 2.4 6.1 2.1 6.0
2014 6.3 8.5 9.3 7.0 7.4
2015 1.5 5.5 (1.9) (0.8) 4.8

Figure 2 – Year-by-Year Results

The performance results for each Sector/Time Period combination in Figure 1 appears in Figure 3.

  FCYIX FSCGX FSCPX FSHOX FSPHX
Month Start Oct Oct Oct Oct Oct
TD Start 19 19 19 19 19
Month End Dec Jan Dec Jan Dec
TD End 3 6 22 1 6
# Up 15 19 18 23 23
# Down 2 4 6 4 4
% times UP 88.2 82.6 75.0 85.2 85.2
% Times Down 11.8 17.4 25.0 14.8 14.8
Average% +(-) 5.1 7.6 5.0 8.6 3.9
Median %+(-) 5.9 7.7 5.8 7.6 4.6
Max. % Gain 10.9 19.3 16.4 32.5 11.0
Max. % Loss (2.0) (6.6) (8.1) (10.1) (2.6)

Figure 3 – Summary Results

The following charts show the growth of $1,000 invested in each sector fund only during the seasonally favorable period designated in Figure 1.

fcyix

Equity Curve for ticker FCYIX (1999-present)

fscgx

Equity Curve for ticker FSCGX (1992-present)

fscpx

Equity Curve for ticker FSCPX (1992-present)

fshox

Equity Curve for ticker FSHOX (1989-present)

fsphx

Equity Curve for ticker FSPHX (1989-present)

Summary

The 4th quarter has generally been kind to the sectors highlighted above.  That’s the Good News.  The Bad News is that – as always – there is absolutely no guarantee that any of these sectors will rise in price between now and the end of the “seasonally favorable” period designated in Figure 1.

Jay Kaeppel

Down the (Oil) Well One More Time

A while back I wrote an article about a hypothetical bearish position using options on ticker USO – an ETF that (purports to) track the price of crude oil.  Long story short, it didn’t work out. USO rallied and the position that had downside profit potential and a maximum risk of -$2,650 was theoretically stopped out when resistance was broken for a loss of roughly -$680.

See also We Are Living in a Material(s) World – Part 2

And now I am looking at another bearish position in USO.  Whoa, is that a good idea?  I mean the last bearish trade didn’t work out, so why risk throwing good money after bad?  For one simple reason: one trade – any trade – has absolutely nothing to do with any other trade.  If one’s analysis suggests that a bearish position in a particular stock, index, commodity, etc., is in order, then a bearish position is in order – regardless of what happened “last time”, or the time before that.

Seasonality in Crude Oil

Figure 1 displays the annual seasonal chart for spot crude oil since oil futures started trading in 1983. Anything jump out at you?1
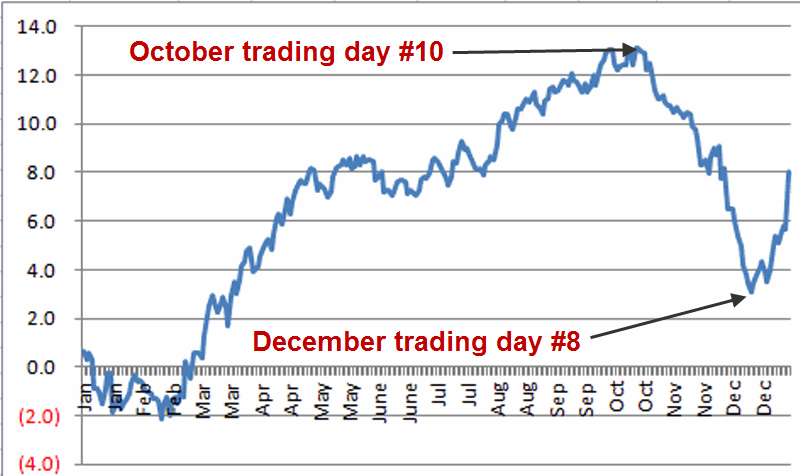
Figure 1 – Annual Seasonal trend for crude oil

As you can see in Figure 1, the period between October trading day #10 and December trading day #8 has tended to by an “unhappy time” for people holding a long position in the slick stuff.

Figure 2 displays the gain or loss a trader might have experienced by holding a long position in crude oil futures during our unfavorable seasonal period going back to 1983.2
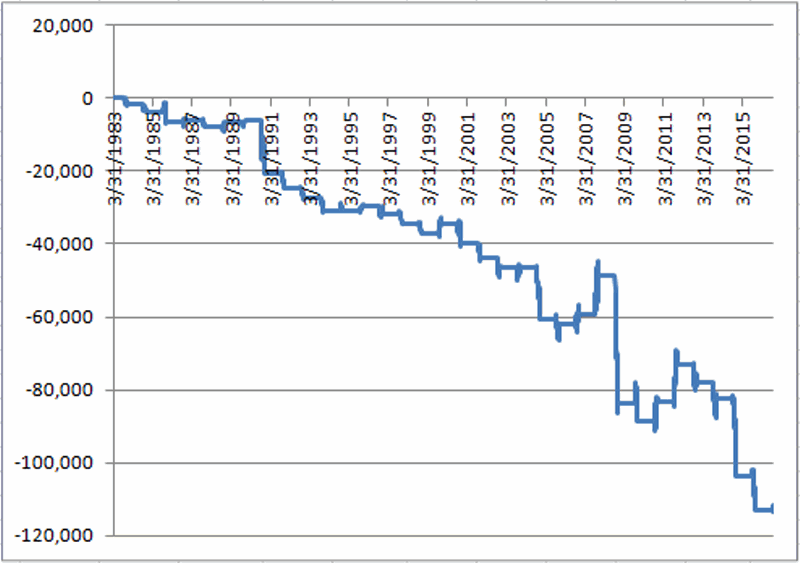
Figure 2 – $ +(-) holding a long position in crude oil futures from October Trading Day #10 through December Trading Day #8; 1983-present

For the record:

*Up 8 times (25%)

*Down 24 times (75%)

*Average gain = +$3,859

*Average loss = (-$6,165)

*Largest up moves = +$10,700 (2007) and +$10,600 (2012)

*Largest down moves = -$35,100 (2008) and -$21,050 (2014)

The 10th trading day of October was October 14, 2016. So far crude oil futures and ticker USO are roughly unchanged.  The most direct way to play would be to sell short crude oil futures.  But at $1,000 a point – and given the maximum up and down moves listed above – crude oil futures are absolutely in the “high risk/high reward” category and not appropriate for most traders.  In order to limit our risk we will look instead at put options on ticker USO.

USO Options, Implied Volatility and Time Premium

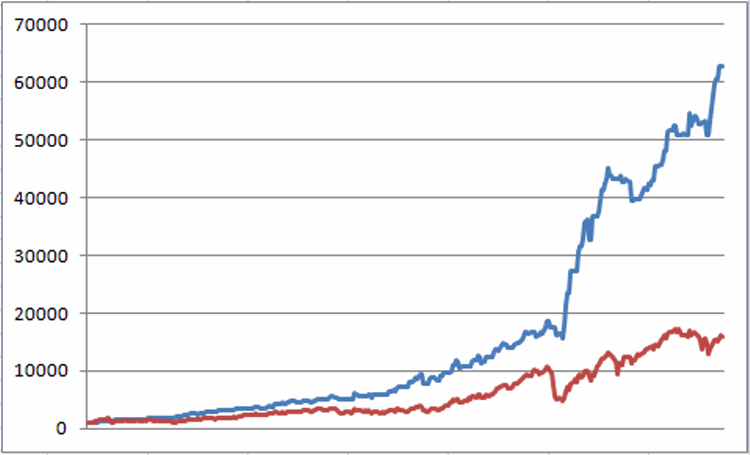
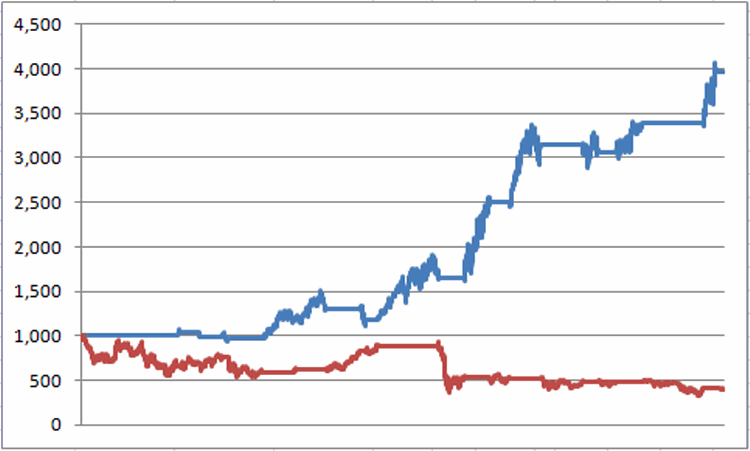
Figure 3 displays the price action for USO over five years and the changes in the implied volatility (the black line) for options on USO.  Low IV tells us that there is relatively little time premium built into the price of the options while high IV tells us that there is a lot of premium built into the price of the options.  This matters because “time decay” causes all options to lose their entire time premium by expiration.3
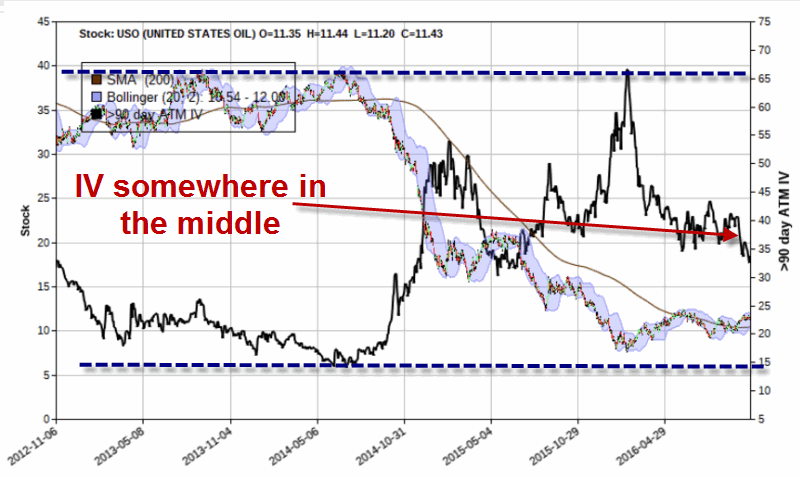
Figure 3 – USO price and implied volatility (IV) history

As you can see in Figure 3, presently  the implied volatility for USO options is essentially in the middle of the 5 year historical range. Therefore we could see a large increase OR a large decline in implied volatility (or no change at all).  In other words, it is essentially a coin flip to predict what will happen next in implied volatility for USO options. Based on a bearish outlook for price and no outlook whatsoever for IV we are going to look at a strategy that mitigates the effect of time decay.

One way to mitigate time decay is to write options.  However, the time to do that is when IV is extremely high.  As we saw in Figure 3 it is presently neither high nor low.  So we will look to buy options.  If you want to limit the risk of time decay when buying options the best approach is simply not to pay very much to begin with.  So for this example we will use a strategy known as “buying a deep-in the-money” put option.  This simply means that we will buy a put option with a strike price well above the current price of the underlying security.

The Trade

For this example our trade is as follow:

Buy 12 USO Dec 13 puts @ $1.70

December options are the first series that we can hold through (i.e., they do not expire prior to) December trading day #8. As you can see in Figure 4 below, the 13 strike price has a relatively tight bid/ask spread of $1.67 bid/$1.70 ask and there is also some volume at this strike – as opposed to some of the higher strikes.4
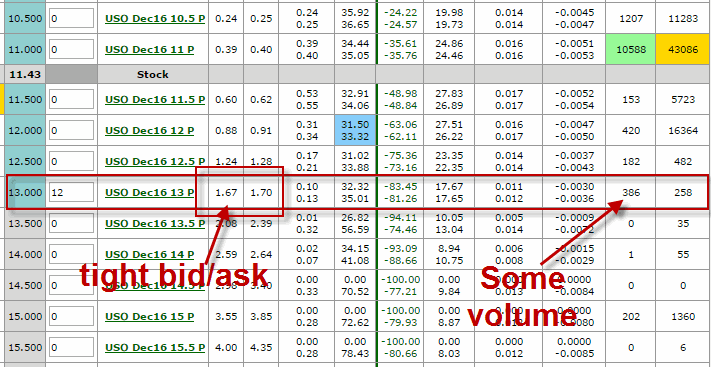
Figure 4 – USO December put options (Courtesy www.OptionsAnalysis.com)

The particulars for this trade appear in Figure 5 and the risk curves in Figure 65
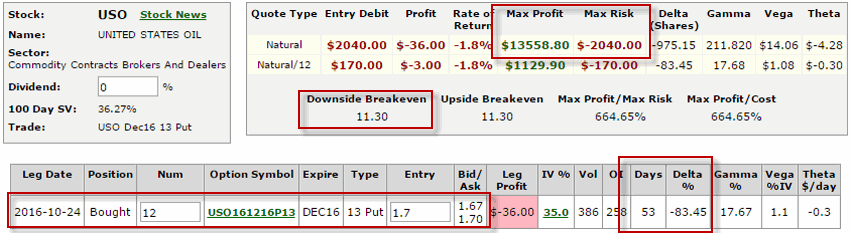
Figure 5 – Long 12 USO Dec13 puts (Courtesy www.OptionsAnalysis.com)

Note that as this is written, USO is trading at $11.43 a share.  Note also in Figure 5 that the breakeven price for this trade is $11.30 a share.  This is arrived at using the following formula: (Option strike price – option premium), or ($13 – $1.70) = $11.30.

So once USO falls -1.1% – from $11.43 to $11.30 – then below that price the option will move point-for-point with the shares (see Figure 6).6
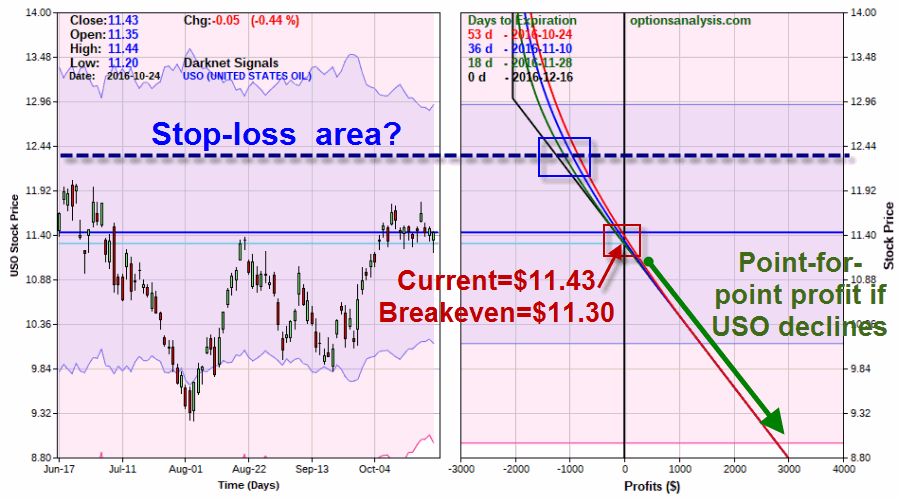
Figure 6 – Risk curves for Long 12 USO Dec13 puts (Courtesy www.OptionsAnalysis.com)

There is no “set in stone” stop-loss point for this trade.  If a trader is willing to risk the full $2,040 he or she can simply “let it ride” if USO starts to move higher knowing that the maximum risk is limited to  that amount.  Other traders might consider a stop-loss point somewhere above the recent resistance level $12.45 a share for USO.

Summary

This trade has:

*Limited risk

*A close breakeven point

*An obvious resistance level above that might be used as a stop-loss point, and;

*The potential to make money if USO falls even a little bit in the weeks ahead.

All that being said, as always, trades presented here are “examples” and NOT “recommendations”.   As  I noted at the outset, I have been wrong before on  crude oil. The example shown here simply constitutes a “soup to nuts” lesson in one way to play a potential decline in the price of crude oil.

Jay Kaeppel

We Are Living in a Material(s) World – Part 2

In my last piece I wrote about a method for deciding when to hold basic materials stocks. In this piece, let’s take a look at another.

(See also We Are Living in a Material(s) World)

FSDPX is the ticker for Fidelity Select Basic Materials, whose first full month of trading was October 1986.  Our system (such as it is) for trading FSDPX is as simply to buy and hold FSDPX during the following months:

February/March/April/May/July/November/December

Not much of a “system” really.  Still, the results are interesting. For testing purposes we will assume that an annual rate of interest of 1% is earned while out FSDPX.  Monthly returns for FSDPX involve monthly total return data from Callan Associates.

Results

Figure 1 displays the growth of $1,000 invested in FSDPX only during the months listed above (blue line), versus buy-and-hold (red line).1Figure 1 – Growth of $1,000 invested in ticker FSDPX during favorable months (blue line) versus buy-and-hold (red line)

For the record:

Measure System Buy/Hold
$1,000 becomes $62,897 $15,853
Cumulative %+(-) +6,190% +1,485%
Average 12-mo % +(-) +15.5% +10.7%
Std. Deviation of 12-mo %+(-) 15.66% 20.24%
Maximum Drawdown -15.7% -56.1%

Figure 2 – FSDPX: Favorable Months vs. Buy-and-Hold

Summary

Over the course of 30 years this monthly system accumulated greater profits than a buy-and-hold approach (which, of course, does not in anyway guarantee that it will continue to in the future). Perhaps just as importantly, it reduced the volatility of the overall results – with 12-month standard deviation of 15.5% versus 20.24% for buy-and-hold, and a maximum drawdown of -15.7% versus -56.1% for buy and hold.

Jay Kaeppel

We Are Living in a Material(s) World

Basic materials.  Where would we be without them?  Outside mostly, I guess. Anyway, despite the undeniable importance – and tangible value of – basic materials, like everything else there is a time “hold ‘em” and a time to “fold ‘em.”  So let’s take a look at one – admittedly crude – method for determining what time it is at any given, er, point in time.

The First Key to Materials Price Trend

The first key to the price trend for materials is, well, the price trend for materials.  For our basic crude purposes we will use the 5-week and 30-week moving average for ticker RYBIX (Rydex Basic Materials fund). If the 5-week MA is greater than the 30-week MA our price trend indicator is bullish and vice versa.  As a “stand alone” indicator, this one ranks in the “Good, not great” category.  Figure 1 displays the growth of $1,000 invested in RYBIX when the 5-week MA is above the 30-week and vice versa.

(For the record there is a 1-day lag in trading – i.e. – if a crossover occurs on Friday’s close the trade in RYBIX takes place at the closing price of the next trading day).1Figure 1 – Growth of $1,000 invested in RYBIX when RYBIX 5-week MA > RYBIX 30-week MA (blue line) versus 5-week MA < 30-week MA (red line); 4/14/1998-10/14/2016

For the record:

*$1,000 invested in RYBIX when the trend indicator is bullish grew to $2,508

*$1,000 invested in RYBIX when the trend indicator is bearish fell to $615

The Second Key to Materials Price Trend

The second part of our model is the action of the U.S. Dollar.  Materials prices tend to move inversely to the price of the U.S. Dollar (I would offer an explanation but it is one of those boring topics that runs the risk of causing readers to stop reading before they get to the good part – so I’ll not take that chance (may I suggest Google?).

From 1998 (when RYBIX started trading) until the end of 2008 I used U.S. dollar futures (ticker DX) as an “inverse” indicator – i.e., if DX 5-week MA is below its 30-week MA that is “bullish” for materials and vice versa.

Since at the end of 2008 I have used ticker UDN (Powershares U.S. Dollar Index Bearish fund). UDN and RYBIX trade with a high degree of correlation.  When the 5-week MA for UDN is above its 30-week MA that is “bullish” for materials and vice versa.

Figure 2 displays the growth of $1,000 invested in ticker RYBIX when our “Dollar Model” is bullish versus bearish.2Figure 2 – Growth of $1,000 invested in RYBIX when UDN 5-week MA > UDN 30-week MA (blue line) versus 5-week MA < 30-week MA (red line); 4/14/1998-10/14/2016

For the record:

*$1,000 invested in RYBIX when the trend indicator is bullish grew to $3,308

*$1,000 invested in RYBIX when the trend indicator is bearish fell to $466

Putting the Two Together to create a “Materials Model”

For RYBIX: if the 5-week MA > 30-week MA then add +1

For UDN: if the 5-week MA > 30-week MA then add +1

So for any given day, the “Materials Model” can read 0, +1 or +2.  To make a long story short, the only time to bother holding materials is when the Materials Model reads +2.

Figure 3 displays the weekly charts for UDN and RYBIX with the 5-week MA and 30-week MA. Our “Materials Model” is bullish when the green line (5-week MA) is above the red line (30-week MA) in BOTH charts.4Figure 3 – Tickers UDN and RYBIX with 5-week and 30-week moving (Courtesy AIQ TradingExpert)

Figure 4 displays the growth of $1,000 invested in ticker RYBIX when the Materials Model = +2 versus when the model is at 0 or 1.3Figure 4 – Growth of $1,000 invested in RYBIX when “Materials Model” = +2 (blue line) versus when Model < +2; 4/14/1998-10/14/2016

For the record:

*$1,000 invested in RYBIX when the Materials Model is +2 grew to $3,965

*$1,000 invested in RYBIX when the Material Model is < +2 fell to $389

Summary

So this model is inarguably crude.  Still, as a proud graduate of “The School of Whatever Works” (good ole’ SWW) the difference between a return of +297% versus a loss of -61% is enough to get my attention.

As you can see in Figure 3, at the moment the price trend indicator is “bullish” and the dollar indicator is “bearish.”  Until they are both bullish I will stand athwart the “materials world.”

Jay Kaeppel

A Must-Read Article on the State of the Economy

Timothy B. Lee has written an article published in VOX titled

27 Charts That Will Change How You Think About the American Economy

I cannot urge you strongly enough to take a few minutes to read it the whole way through.  And note that unlike a lot (dare I say, most) of the information regarding the economy that gets put out these days there is no “angle” or political agenda underlying the data (at least not that I could discern).

(See also Buy Real Estate Stocks (3 Times a Year))

The “times they are a changing” and this article provides an enlightening yet dispassionate look at “the way things are”.

Do yourself a favor and read it all the way through.

Jay Kaeppel

Buy Real Estate Stocks (3 Times a Year)

There is a season, turn, turn, turn.  OK, as a “rock n’ roll guy” I always found that song to be a little wimpy. But as a stock market analyst I find it to be a pretty useful phrase.

(See also The Best Bear Market Strategy)

The Real Estate Sector

There are many factors that affect real estate stocks.  The economy, interest rates, the availability of credit, and so on.  But the most valuable tool when it comes to trading real estate stocks might just be the calendar.  So let’s take a look.

The 3 “favorable” times of year for real estate are:

*From the close of March Trading Day #1 through the close of May Trading Day #8

*From the close of June Trading Day #17 through the close of July Trading Day #21

*From the close of November Trading Day #14 through the close of December Trading Day #22

For our first test, Figure 1 displays the growth of $1,000 invested in Fidelity Select Real Estate fund (ticker FRESX) only during these 3 periods since 9/30/1988, versus buying and holding FRESX during the same period.  We assume an annualized rate of interest of 1% is earned while not in FRESX.1Figure 1 – Growth of $1,000 invested in FRESX during seasonally favorable periods (blue) versus buy-and-hold (red); 9/30/1988-10/7/2016

For the record, from 9/30/1988 to 10/7/2016:

*The 3 seasonally favorable periods gained+5,360% with a maximum drawdown of (-20.4%).

*Buy-and-Hold gained+1,730% with a maximum drawdown of (-76.3%).

One alternative for more aggressive traders is ProFunds Real Estate UltraSector (ticker REPIX) which uses leverage of 1.5-to-1 and has no switching restrictions.  This fund started trading on 8/8/2000. Figure 2 displays the growth of $1,000 invested in REPIX only during our 3 favorable periods since 8/8/2000, versus buying and holding REPIX during the same period.2Figure 2 – Growth of $1,000 invested in REPIX during seasonally favorable periods (blue) versus buy-and-hold (red); 8/8/2000-10/7/2016

For the record:

*The 3 seasonally favorable periods gained+2,747% with a maximum drawdown of (-31.7%).

*Buy-and-Hold gained+172% with a maximum drawdown of (-91.2%).

Figure 3 displays the year-by-year results for REPIX using the seasonally favorable periods versus buy-and-hold.

3

Figure 3 – Seasonal REPIX versus Buy-and-Hold

*2000 – from 8/8/2000 through 12/31/2000

**2016 – from 12/31/2105 through 10/7/2016

***Average – includes only full calendar years

Summary

The real estate sector is a lot like the energy sector in that when it’s good it’s great and when it’s bad it is very, very bad.  Investing in sectors like these on a “part-time basis” might not be the worst idea in the world.

Jay Kaeppel