OK, I typically prefer to attempt the clever title (such as it is) rather than the “bombastic.” But I have this vision in my head of the bond market somewhere down the road. And if you have been investing in bonds in any form during any or all of the last 40 years you really should read what follows……because one day everything you think you know about the bond market will be wrong!
(And a bombastic opening paragraph too! I really need to get out more. Unfortunately, just like you, I can’t. But I digress.)
Anyway, first off please note that historically interest rates have tended to move in roughly 60-year cycles – 30 years down, 30 years up. This is not a “precise, like clockwork” kind of thing, but it has been generally accurate. Or it least it was.
Figure 1 was presented by Tom McClellan of www.McClellanOscillator.com. You can see for yourself the tendency for rates to decline for 30 years and then rise for a similar time. Not always, not exactly, but as far as “guidelines” go, it’s been very useful.
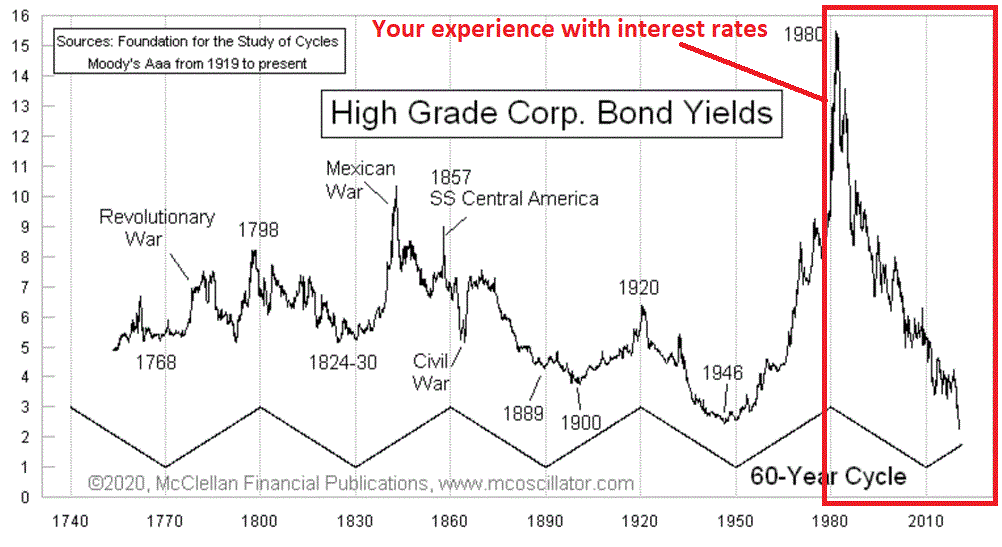
Figure 1 – History of Bond Yields (Courtesy: www.mcoscillator.com)
Note the red box in Figure 1. If you started investing anytime after roughly 1981, then your entire experience with interest rate – and by extension, the bond market – has been – for lack of a more professional sounding phrase – “Totally AWESOME!!” (Sorry, I’ve been at home with the kids for over a month now).
The Good News:
During the course of your lifetime you have enjoyed arguably the greatest bond market in history. Congratulations.
The Bad News:
Nothing lasts forever – especially in the financial markets.
As you can also see on the far right-hand side of the graph, we are now almost a full decade “overdue” for rates to reverse and move higher. Which of course seems highly unlikely at the moment. With the Fed and other Central Banks around the globe pumping money like crazy as a result of the Covid-19 panic, the likelihood of negative interest rates here in the U.S. seems much greater than the likelihood of a rise in rates anytime soon.
Still, the chart in Figure 1 reminds us that however far away the low in interest rates may be in terms of level and time, rates are unlikely to stay down forever.
Here’s the Point
Let’s just come right out and say it:
*Interest rates WILL NOT stay low forever
*When they rise, unlike in the past there will be very little yield to offset the decline in bond prices
*When you buy a bond with an extremely low yield you are likely locking in a very low rate of return (to understand why please see this article).
When you buy a bond with an extremely low yield you are in essence buying a “hoped for trend continuation”. However, in no way are you buying “value” of any sort. Buying a bond with a yield of 1% or so (or less) is not unlike buying the S&P 500 when the P/E ratio is over 30. The trend may continue for a given period of time – but the long-term reward-to-risk profile is NOT positive.
In the meantime, the longer-term prospects (10 years) for bonds are not great. In this article I highlighted the fact that the best estimator of the future 10-year total return for a bond is it’s current yield. With yields presently as low as they are:
*Price appreciation will be hard to come by
*Interest paid is minimal
Not a particularly appetizing combination.
Drilling Down on Long-Term Treasuries
The purest play on interest rates are long-term treasury bonds. When rates fall, long-term treasuries rise and vice versa. Many investors recognize this fact, but few understand the sheer magnitude of impact that interest rates have on long-term bond price movements. So let’s spell it out.
Figure 2 displays 30-year treasury yields since December 1976.
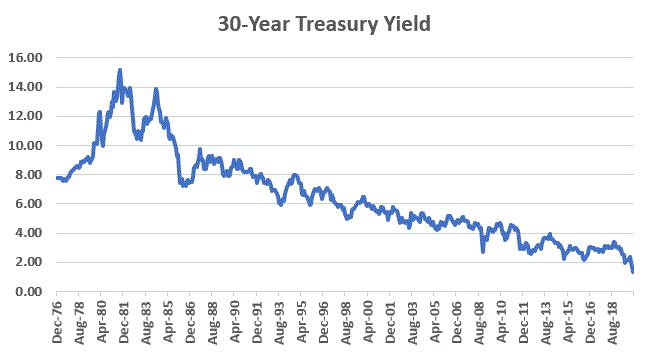
Figure 2 – 30-yr treasury yields; 1976-2020
For testing purposes (and in order to test the longest period possible), we will use monthly total return index data for the Bloomberg Barclays’s Long Treasury Index to measure gains and losses for long-term treasuries.
Figure 3 displays the cumulative total return for long-term treasuries during the same period. Pretty great, right!?
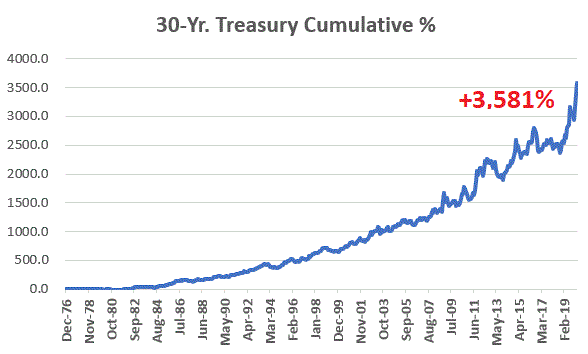
Figure 3 – Long-term treasury cumulative return 1976-2020 (source: Bloomberg Barclays Long Treasury Index monthly total return data)
But there is an important thing to note:
*The ONLY reason Figure 3 slopes upward to the right is because Figure 2 slopes downward to the right. Nothing more, nothing less.
*If (when) Figure 2 starts “sloping up”, Figure 3 will start to look a lot different.
The proof: With the benefit of perfect hindsight, Figure 4 breaks the past 44 years into shorter “falling rate periods” and “rising rate periods”.
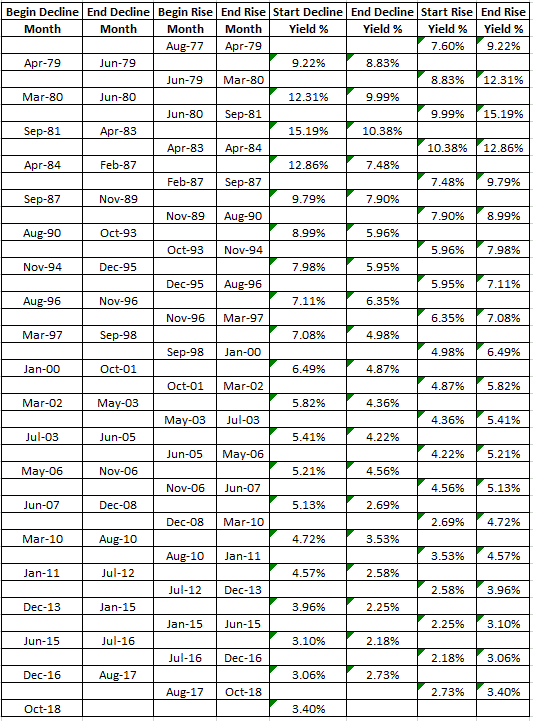
Figure 4 – Rising and Falling Rate Periods; 1977-2020
Now let’s take a (hopefully) clarifying look at the effect of interest rate movements on long-term treasuries.
*Figure 5 displays the cumulative return for long-term treasuries ONLY during the “falling rate periods” in Figure 4
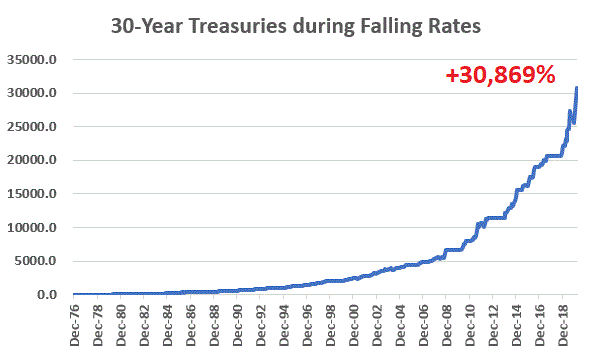
Figure 5 – Cumulative returns for long-term treasuries ONLY during “falling rate periods”
*Figure 6 displays the cumulative return for long-term treasuries ONLY during the “rising rate periods” in Figure 4
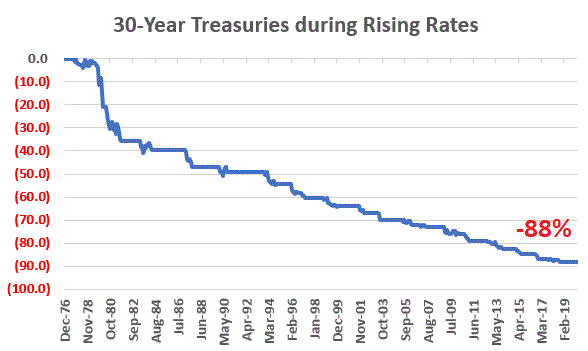
Figure 6 – Cumulative returns for long-term treasuries ONLY during “rising rate periods”
Notice a difference? Just to be sure, note the cumulative return during:
*Rising rate periods = +30,869%
*Falling rate periods = -88%
Any questions on the effect of changes in interest rates on long-term bonds?
Spelling It Out
Just to be clear, in the past 30+ years interest rates have spent a lot more time declining than they have rising. When the long-term rate cycle eventually changes to a long-term rising rate environment, then rates will spend more time rising than falling.
Figures 5 and 6 tell us that this WILL NOT be a good thing for holders of long-term bonds.
What You Need to Know: The Short Answer
Timing every up and down in rates is not possible. But fortunately, because the big long-term swings tend to be measured in decades, we can typically ride the primary trend most of the time (FYI, you’ve been riding one for the past roughly 39 years).
Figure 7 displays the same chart as the one contained in Figure 2 but with a 120-month exponential moving average (more on how to calculate this later) overlaid.
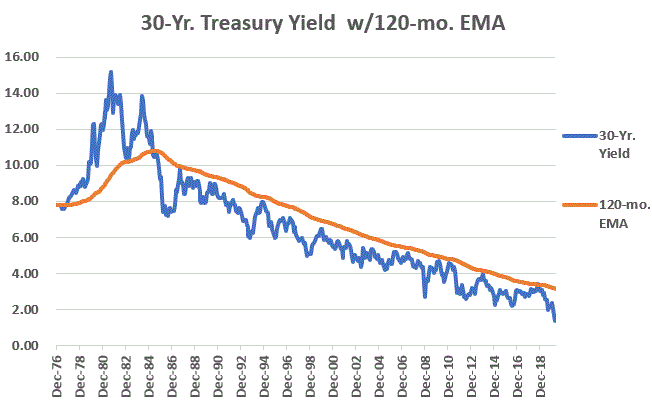
Figure 7 – 30-year treasury yields with 120-month exponential moving average
So here is what you need to remember (as succinctly as possible):
If 30-year yields are above their 120-month exponential moving average:
*DO NOT HOLD 30-YEAR BONDS!!
*Hold short to intermediate bonds or cash
At the end of March 2020 ticker TYX was at 1.35% and the 120-month EMA was at 3.15%, so this is obviously not something you need to worry about anytime soon. In fact, with the Fed working 24/7 to push interest rates lower, it will likely be quite some time before this signal occurs again.
But the day will come. And when it does, the impact on your investments and investment strategies will be profound.
I myself use and follow strategies that incorporate long-term treasuries – and boy do the results look great for the past 30+ years! But we (myself included) are kidding ourselves if we believe that the next 30+ years will look anything like the last 30+ years. Which I am pretty sure means it’s time to invoke….
Jay’s Trading Maxim #12: Murphy’s Corollary states the following: Murphy hates you. Plan accordingly.
Stay tuned for Part II
TECHNICAL NOTE: How to calculate a 120-month exponential moving average for ticker TYX (30-year treasury yield).
You can get this value for TYX at (among other places) www.StockCharts.com by entering $TYX as the Symbol.
A = # of periods (in this case we are using 120)
B = 1-C >>>>>>(.9835)
C = 2 / (A+1) >>>>>(0.0165)
D = Last month’s EMA * B
E = This month’s month-end value for TYX (divided by 100) * C
The 120-month EMA = D + E
So:
The 120-month EMA at the end of March 2020 was 3.15, so:
D = 3.15 * 0.9835
E = April close for TYX * 0.0165
120-EMA at end of April = D + E
Like I said, it won’t do much for you anytime soon. But one day…
Jay Kaeppel
Disclaimer: The information, opinions and ideas expressed herein are for informational and educational purposes only and are based on research conducted and presented solely by the author. The information presented represents the views of the author only and does not constitute a complete description of any investment service. In addition, nothing presented herein should be construed as investment advice, as an advertisement or offering of investment advisory services, or as an offer to sell or a solicitation to buy any security. The data presented herein were obtained from various third-party sources. While the data is believed to be reliable, no representation is made as to, and no responsibility, warranty or liability is accepted for the accuracy or completeness of such information. International investments are subject to additional risks such as currency fluctuations, political instability and the potential for illiquid markets. Past performance is no guarantee of future results. There is risk of loss in all trading. Back tested performance does not represent actual performance and should not be interpreted as an indication of such performance. Also, back tested performance results have certain inherent limitations and differs from actual performance because it is achieved with the benefit of hindsight.

