Buying bonds or bond funds is usually done with a specific “purpose” in mind – growth of capital (if interest rates are falling), generating income, as an offset to stocks returns in a combined portfolio, and as a safe haven in times of extreme volatility. And for each purpose the action can make sense. For example, treasury securities have been an excellent safe haven during the recent coronavirus panic.
But does anyone really know what to expect when they get in? As it turns out, there is a simple and useful way to estimate what to expect. I am pretty sure that what I am about to describe is very similar to (if not unintentionally entirely lifted from) what John Bogle, the founder of Vanguard Investors described in one of his books that I read many years ago and can’t seem to locate. It goes like this:
*To estimate the expected return for a bond over the next 10 years look at it’s current yield
Did I mention it was simple?
Can this simple method really be of value? Generally speaking, yes. Specifically, it depends. Most investors don’t buy a bond and hold it for 10 years. They tend to move in and out of the bond market based on a desire to fulfill one of the “purposes” listed above. Still, a little bit of foresight might be helpful, right?
The Test
For testing purposes, I looked at the 10-year treasury.
*I looked at the current yield on a 10-year treasury at the end of each year starting on 12/31/1972 (using data downloaded from MacroTrends.net at https://www.macrotrends.net/2016/10-year-treasury-bond-rate-yield-chart)
*I then used monthly total return data to generate 10-year bond returns for the following 10 years
Figure 1 displays the data from Figure 2 below in a graphical format.
*The blue line represents the beginning current yield at the start of each 10-year test period and the orange line displays the annualized total return over the following 10 years.
The correlation between beginning yield at the start of each 10-year test period and subsequent 10-year return is fairly obvious. For the record, the correlation between the beginning yield and the subsequent 10-year return in 0.80 (1.00 means an exact match).
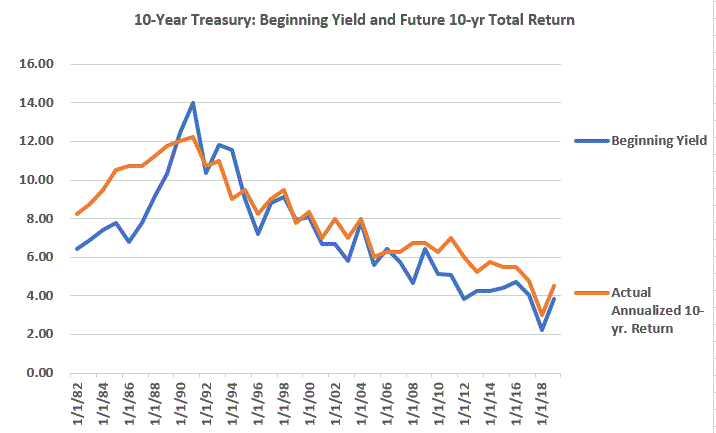
Figure 1 – End of year 10-year yield and subsequent 10-year annualized return
As you can see in Figures 1 and 2, as long as yields are declining, total return roughly equals initial starting yield plus some modest price appreciation, hence the reason the orange line in Figure 1 (total 10-year annualized return) is typically above the blue line (initial starting yield).
Technical Note On Data Used
*The first month of data I have for the Bloomberg Barclays 10-year Treasury Index is January 1992.
*So from January 1973 through December 1991 I used the Bloomberg Barclay’s Intermediate Index (which technically correlates more closely with a 3-7 year bond) to calculate total returns for bonds;
*Starting in January 1992, I used the 10-year treasury index to calculate total returns for bonds. I wanted to run the longest test I could, plus I am not conducting a precise science experiment here, only highlighting a general trend, so if we end up mixing red apples with green apples a bit, so be it.
Figure 2 displays the data.
*Column 1 is the start date
*Column 2 is the end date
*Column 3 is the 10-year yield on the start date
*Column 4 is the actual annualized return for intermediate-term treasuries over the subsequent 10-year test period
For example, we see that on 12/31/1972 the 10-year yield was 6.41%. Over the next 10 years the 10-year bond achieved an average annual total return of 8.25%.
| Start Date | End Date | Beginning Yield | Actual Annualized 10-yr. Return |
| 12/31/72 | 12/31/82 | 6.41 | 8.25 |
| 12/31/73 | 12/31/83 | 6.90 | 8.75 |
| 12/31/74 | 12/31/84 | 7.40 | 9.50 |
| 12/31/75 | 12/31/85 | 7.76 | 10.50 |
| 12/31/76 | 12/31/86 | 6.81 | 10.75 |
| 12/31/77 | 12/31/87 | 7.78 | 10.75 |
| 12/31/78 | 12/31/88 | 9.15 | 11.25 |
| 12/31/79 | 12/31/89 | 10.33 | 11.75 |
| 12/31/80 | 12/31/90 | 12.43 | 12.00 |
| 12/31/81 | 12/31/91 | 13.98 | 12.25 |
| 12/31/82 | 12/31/92 | 10.36 | 10.75 |
| 12/31/83 | 12/31/93 | 11.82 | 11.00 |
| 12/31/84 | 12/31/94 | 11.55 | 9.00 |
| 12/31/85 | 12/31/95 | 9.00 | 9.50 |
| 12/31/86 | 12/31/96 | 7.23 | 8.25 |
| 12/31/87 | 12/31/97 | 8.83 | 9.00 |
| 12/31/88 | 12/31/98 | 9.14 | 9.50 |
| 12/31/89 | 12/31/99 | 7.93 | 7.75 |
| 12/31/90 | 12/31/00 | 8.08 | 8.36 |
| 12/31/91 | 12/31/01 | 6.71 | 7.00 |
| 12/31/92 | 12/31/02 | 6.70 | 8.00 |
| 12/31/93 | 12/31/03 | 5.83 | 7.00 |
| 12/31/94 | 12/31/04 | 7.84 | 8.00 |
| 12/31/95 | 12/31/05 | 5.58 | 6.00 |
| 12/31/96 | 12/31/06 | 6.43 | 6.25 |
| 12/31/97 | 12/31/07 | 5.75 | 6.25 |
| 12/31/98 | 12/31/08 | 4.65 | 6.75 |
| 12/31/99 | 12/31/09 | 6.45 | 6.75 |
| 12/31/00 | 12/31/10 | 5.12 | 6.25 |
| 12/31/01 | 12/31/11 | 5.07 | 7.00 |
| 12/31/02 | 12/31/12 | 3.83 | 6.00 |
| 12/31/03 | 12/31/13 | 4.27 | 5.25 |
| 12/31/04 | 12/31/14 | 4.24 | 5.75 |
| 12/31/05 | 12/31/15 | 4.39 | 5.50 |
| 12/31/06 | 12/31/16 | 4.71 | 5.50 |
| 12/31/07 | 12/31/17 | 4.04 | 4.75 |
| 12/31/08 | 12/31/18 | 2.25 | 3.00 |
| 12/31/09 | 12/31/19 | 3.85 | 4.50 |
Figure 2 – End of year 10-year yield and subsequent 10-year annualized return %
*For the record, I rounded the 10-year annualized return to the nearest quarter percent.
The Future
At the end of 2019, the 10-year yield was roughly 1.9% (it is presently in the 0.7% range). If history is a guide it suggests that bond investors will need to be even more strategic in how they utilize bonds in the years ahead, as simply buying and holding low yield bonds for long periods of time appears unlikely to generate significant returns.
Jay Kaeppel
Disclaimer: The information, opinions and ideas expressed herein are for informational and educational purposes only and are based on research conducted and presented solely by the author. The information presented represents the views of the author only and does not constitute a complete description of any investment service. In addition, nothing presented herein should be construed as investment advice, as an advertisement or offering of investment advisory services, or as an offer to sell or a solicitation to buy any security. The data presented herein were obtained from various third-party sources. While the data is believed to be reliable, no representation is made as to, and no responsibility, warranty or liability is accepted for the accuracy or completeness of such information. International investments are subject to additional risks such as currency fluctuations, political instability and the potential for illiquid markets. Past performance is no guarantee of future results. There is risk of loss in all trading. Back tested performance does not represent actual performance and should not be interpreted as an indication of such performance. Also, back tested performance results have certain inherent limitations and differs from actual performance because it is achieved with the benefit of hindsight.

