Monthly Archives: December 2013

Happy Days are Only Nine Months Away, Apparently

Please see my new article in Technical Analysis of Stocks & Commodities magazine titled “New Tricks With Old Indicators” (http://traders.com/) On Sale Now.

Well it’s almost 2014.  Time for my annual stock market prediction.

Yah, right.  Sorry, I don’t do predictions.  Actually, for the record I do, but only in my head – for fun.  So you’ll just have to take my word for it that my “predictions track record” isn’t too good.

Now that may sound like a startling self-deprecating admission, but the reality is that I have a tremendous amount of company –made up of people who actually do make predictions “out loud.”

Let me be clear on how I see it: Predictions are a waste of time.  Trends are what matters. At the moment it would be impossible to argue that the trend of the stock market is not “up.”  So that is the way to play until shown otherwise.

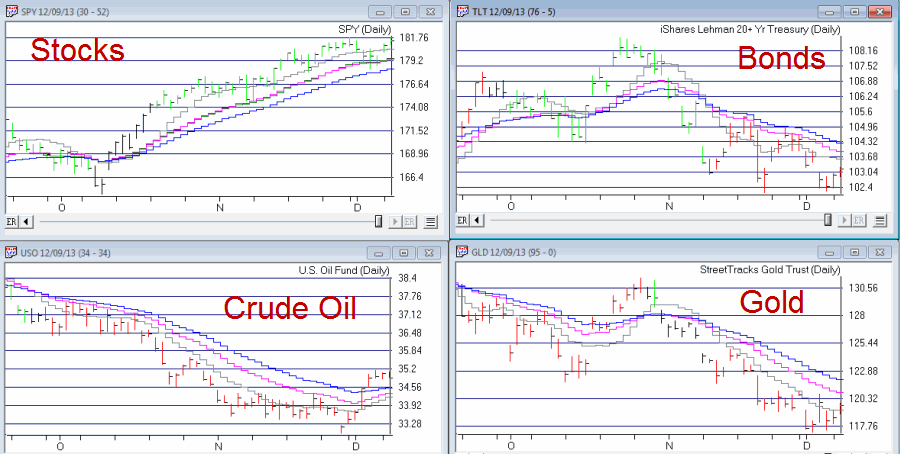
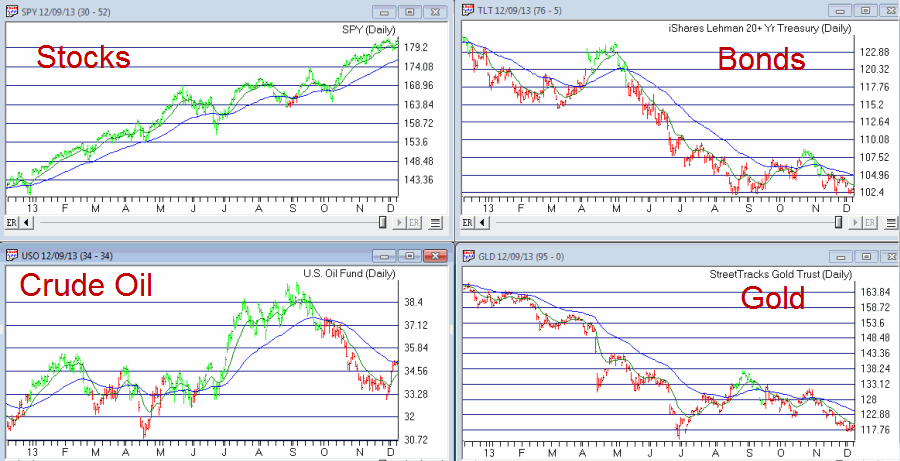
But there are other trends we can also consider in terms of looking ahead.

The Mid-Term Election Year

To put it as succinctly as possible, the mid-term election year has historically been something of a mixed bag.  The good news is that the market has showed a tendency to achieve a “major bottom” during mid-term election years.  The bad news is that many of those major bottoms were preceded by the requisite “major decline” leading up to said “major bottom.”

The other piece of good news is that most of the “bad stuff” has historically been worked out by the end of September.  To illustrate all of this consider the Figures below.

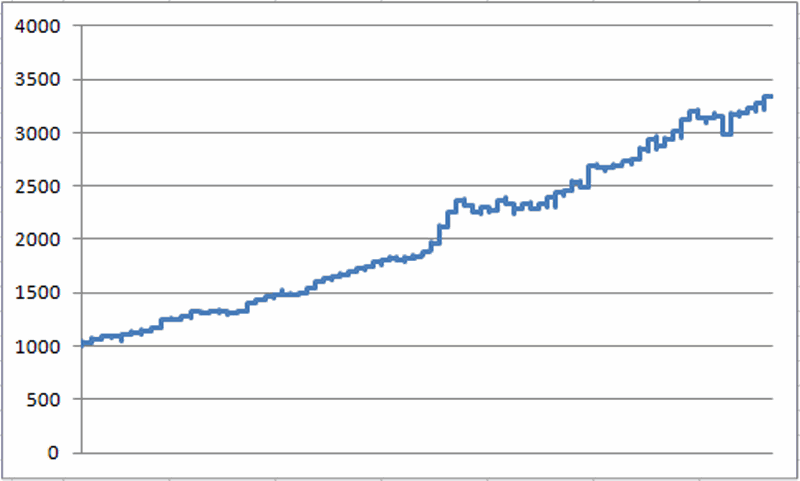
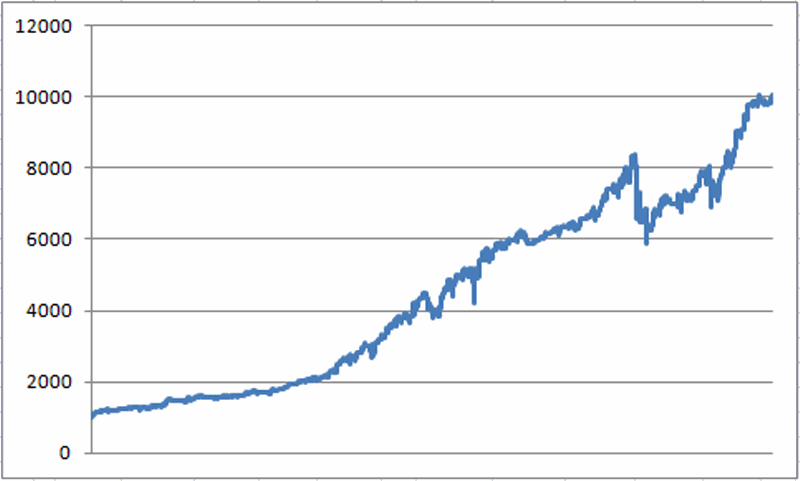
Figure 1 displays the growth of $1,000 invested in the Dow Jones Industrials Average – which can now be achieved by buying a Dow index mutual fund or ETF such as ticker DIA – during every mid-term election year starting in 1934.

jotm20131230-01

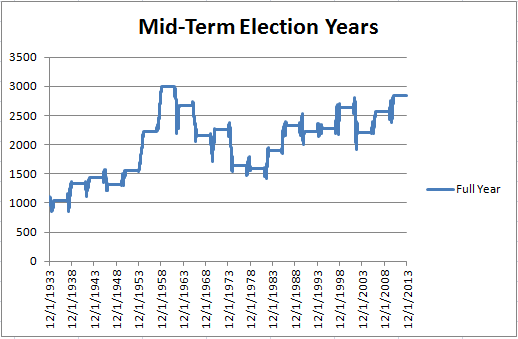
Figure 1 – Growth of $1,000 invested in the Dow Jones Industrials Average every mid-term election year since 1934

For the record, $1,000 invested in the Dow only during every mid-term election year since 1934 grew to $2,841.

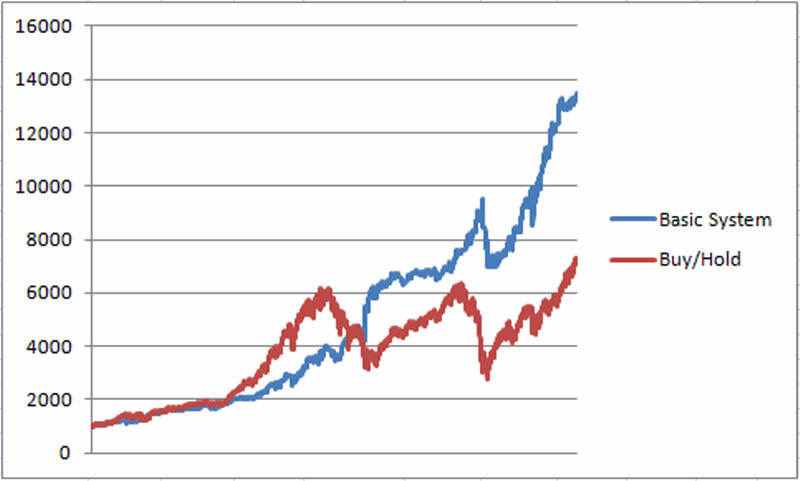
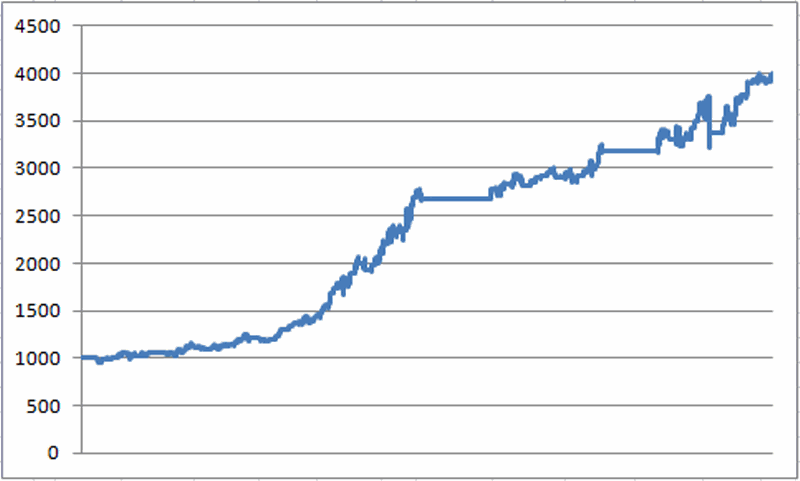
Now in Figure 2, we break each mid-term election year down into two periods:

Period 1 = January through September

Period 2 = October through December

As you can see, there is “a difference.”

jotm20131230-02

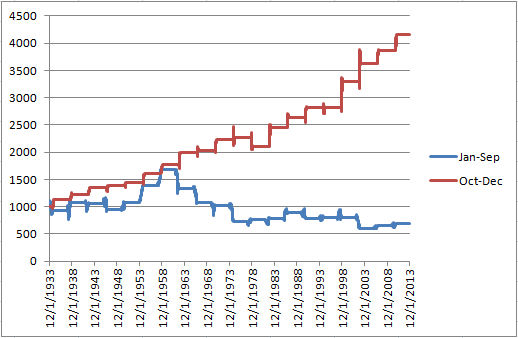
Figure 2 – Growth of $1,000 invested Jan-Sep of mid-term election years (blue line) versus growth of $1,000 invested Oct-Dec of mid-term election years (red line); 1934-present

Here is how it breaks down:

January through September of Mid-Term Election Years = $1,000 declined to $684 (-31.6)

October through December of Mid-Term Election Years = $1,000 grew to $4,154 (+315.4%)

 Summary

So should we “sell everything” and “stuff our money in our mattresses” and “come back in October?”  Well, not necessarily.  As I mentioned at the outset, the trend of the market is presently “up”.  But history suggests that 2014 will not be quite the “smooth sailing” that was 2013.

So for now the tentative game plan is:

-Stick with the trend

-Be alert for changes in the trend (have you noticed there has been a lot more “happy talk” lately – i.e., after the fact justification of why the market is up and how everything will start getting better real soon?  The more you hear that talk, the more alert you need to be).

-Be ready to be in the market after September 30th, 2014.  No matter how things look at that time.

 Addendum

OK, I will make one prediction for 2014 – and I have to say that I have been spot on with this one in the past:

The Cubs WILL NOT win the World Series in 2014.

I’m feeling pretty confident about this one….

Jay Kaeppel 

Wow, It Really is the Most Wonderful Time of the Year!

Please see my new article in Technical Analysis of Stocks & Commodities magazine titled “New Tricks With Old Indicators” (http://traders.com/) On Sale Now.

Some seasonal trends have shown a tendency to persist through time (hence the use of the word “trend”, I guess).  As it turns out we are at the cusp of one of “those times” right now.  It is sitting there like a wrapped gift under the tree with our name on it – so let’s not waste any time diving in.

December-January Changeover

The period we will look at encompasses the last 4 trading days of December and the first 3 trading days of the following January.  In other words, a contiguous 7 day trading period during which the stock market has showed a tendency to behave in a bullish manner.

Now given the persistence of the recent market run up, many may be a little leery of diving in here.  Which I understand.  Still, the numbers are what they are, so let’s take a look.

The Test

So as not to make it easy on ourselves, this test begins in December 1933, i.e., in the early days off the great Depression.  We will buy the Dow Jones industrials Average at the close of the fifth to last trading day of the year and sell at the close of the third trading day of January. This test assumes no interest is earned while out of the market so that we measure only the performance during the supposedly bullish period.

The Results

Figure 1 displays the growth of $1,000 invested in the Dow every year since 1933 during the seven trading days just described.  jotm120131226-01Figure 1 – Growth of $1,000 invested in Dow Industrials during bullish 7-day period (1933-present)

Two anecdotal comments from a quick perusal of the graph in Figure 1:

-There is clearly a lower left to upper right trend, which is what we want to see in any equity curve

-It is by no means “perfect”, so a little closer analysis of the numbers may be useful in convincing ourselves that this trend might actually be useful.  So in order to gain some perspective, let’s compare the performance of the Dow during this time period versus Dow performance for all trading days.

A few figures of note:

-System average daily performance is +0.22% versus +0.03% for all trading days (7.53 times greater).

-System median daily performance is +0.17% versus +0.03% for all trading days (4.00 times greater).

-338 out of 560 system trading days showed a gain (60.4%).

-10,946 out of all 20,922 trading days showed a gain (52.3%).

-Average 7-day return only during system days = +1.55%.

-Average 7-day return for all trading days = +0.20%.

-The 7-day system period has showed a gain in 62 of the past 80 years (or 77.5% of the time)

One other thing to note is that returns (and albeit risk) is enhanced by trading leveraged funds such as ticker UDPIX (Profunds UltraDow) or UDOW (ProShares UltraDow30 ETF).

 Summary

So is the Dow destined to be higher at the close on January 6, 2014 than it was at the close on December 24th, 2013?  Not necessarily.  But that would seem to be the way to bet.

Jay Kaeppel


A Traders Guide to Buying the Dips (Part II)

This article presents another twist to the one I posted a few days ago titled “A Trader’s Guide to Buying the Dips” (http://jayonthemarkets.com/2013/12/13/a-traders-guide-to-buying-the-dips/).  This article presents a variation known as “Jay’s Pullback System”

First let’s look at the building blocks:

A = S&P 500 daily close

B = 10-day simple moving average of S&P 500 daily close

C = (A – B)

Buy Signal = Variable C declines for 3 or more consecutive days

In a nutshell, if the difference between the S&P 500 index (SPX) and its own 10-day moving average declines for 3 straight days we consider this to be a “pullback”, and thus a buying opportunity.

Trading Rules for Basic System:

When Variable C declines for 3 straight days, buy and hold the S&P 500 Index for 5 trading days. If the decline in Variable C extends itself one or more days, then extend the holding period for that many trading days.

So for example, if Variable C declined for 5 straight trading days, one would buy at the close of the third trading day and then hold for seven trading days

Day        Variable C            Action                                                                                   Position

1              Down

2              Down

3              Down                    Buy at close (hold for 5 days)

4              Down                    Hold (Var. C down again; hold for 5 days)              Long

5              Down                    Hold (Var. C down again; hold for 5 days)              Long

6              Up                          Hold (for 4 days)                                                               Long

7              Down                    Hold (for 3 days)                                                               Long

8              Up                          Hold (for 2 days)                                                               Long

9              Down                    Hold (for 1 day)                                                                 Long

10           Up                          Sell at close                                                                         Long; Flat at close

Figure 1 displays “bullish days for SPX in green.  In the lower clip we see the difference between the close and the 10-day moving average (i.e., Variable C).  A “bullish” period is signaled when that value declines for 3 straight daysjotm20131218-01  Figure 1 – Basic System bullish days for SPX (Courtesy AIQ TradingExpert)

 Results:

This is a very rudimentary “system” and not suitable for many traders (note this raw system includes no stop-loss provision and does not attempt to filter for and trade with the major trend).

In any event, let’s look at what would have happened if one had followed the rules and held the S&P 500 for 5 trading days following every decline in Variable C of 3 days or more, and earned 1% of annual interest while out of the market.  Those results are displayed (along with the growth of $1,000 achieved by buying and holding the S&P 500 Index) in Figure 2.jotm20131218-02Figure 2 – Simple Pullback Systems (blue line) versus Buy and Hold (red line) Dec 1987 to present

Results:

-$1,000 invested using this system grew to $13,249 (+1,225%)

-$1,000 invested using buy-and-hold grew to $7,208 (+621%)

So we can reasonably state that these results are pretty good.  Can they be improved? Let’s see.

 Jay’s Pullback System

With this system we will filter for the trend and at times use leverage.

First we will note if the daily close for the S&P 500 Index is above or below its own 250-day moving average.

If Variable C above declines in value 3 straight days:

-If SPX > 250-day moving average we will buy using leverage of 2-to-1

-If SPX < 250-day moving average we will buy using no leverage

-Interest of 1% per year will be assumed when out of the market.

The results of this test appear in Figure 3.jotm20131218-03 Figure 3 – Jay’s Pullback System: Growth of $1,000 (blue line) versus buy and hold (red line; Dec 1987-present

Results:

-$1,000 invested using Jay’s Pullback System grew to $44,541 (+4.354%)

-$1,000 invested using buy-and-hold grew to $7,208 (+621%)

Funds to Use

Mutual Fund: Profunds ticker BLPIX (S&P x 1)

Mutual Fund: Profunds ticker ULPIX (S&P x 2)

ETF: Ticker SPY (S&P 500 x 1)

ETF: Ticker SSO (S&P 500 x 2)

Summary

While the numbers for the leveraged system look pretty good, it should be noted that there are no stop-loss provisions incorporated.  Before you decide to run off and trade any system – particularly one that may use leveraged funds or ETFs, you ought to do some homework and make sure you fully understand and can tolerate the risks involved.

Still, the real point of all of this is simply to note that buying on dips is a valid approach to trade the stocks markets.

Jay Kaeppel

A Trader’s Guide to Buying the Dips

Please see my new article in Technical Analysis of Stocks & Commodities magazine titled “New Tricks With Old Indicators” (http://traders.com/) On Sale Now.

The S&P 500 has declined for three consecutive days.  Should you care? Well, perhaps.  In Figure 1 we see the growth of $1,000 achieved as follows:

-When the S&P 500 registers 3 (or more) consecutive lower closes, buy and hold for the next 5 trading days.

To be clear, the results shown here assume that you buy at the close of the 3rd consecutive down day and plan on holding a long position in the S&P 500 for the at least the next 5 trading days.  This holding period is extended one day for each additional day the S&P declines consecutively.  In other words of the S&P 500 declines for 5 consecutive days, you would buy at the close of the 3rd consecutive down day and hold for 7 trading days.

Not sure of that explanation helped or made things more confusing but there you have it. jotm20131213-01Figure 1 – Growth of $1,000 invested in S&P 500 after 3 (or more) consecutive down closes (December 1987 to present)

In this test, an initial $1,000 grew to $9,869, or +887% (no slippage, commissions, taxes, dividends, interest, etc., just raw price return), with a maximum drawdown of -19.3%.


Filtering for Trend

One of the dangers of this approach is the “Are You Sure You Want to Try to Catch that Falling Safe?” conundrum.  So what happens if we only take the trades that occur when the S&P 500 is in an established uptrend?  If we only take the trades that occur when the S&P 500 is above its 250-day moving average we get some Bad News and some Good News.

The Bad News is that $1,000 grows to $3,935, or +293%.  So clearly a lot of profit potential left on the table.

The Good News is that the maximum drawdown using this method is only a very manageable -9.8%. jotm20131213-02Figure 2 – Growth of $1,000 invested in S&P 500 after 3 (or more) consecutive down closes (December 1987 to present) only when S&P 500 is ABOVE its 250-day moving average


Using Leverage

Figure 3 displays the growth of $1,000 using the following assumptions:

-If the S&P 500 declines 3 or more consecutive days AND the S&P 500 is BELOW its 200-day moving average, buy and hold the S&P 500 index for 5 trading days

-If the S&P 500 declines 3 or more consecutive days AND the S&P 500 is ABOVE its 250-day moving average, buy and hold the S&P 500 index using leverage of 2-to-1 (via a leveraged ETF or mutual fund) for 5 trading days

-For this test we assume that an annualized rate of 1% interest is earned when no position is held.

In a nutshell, if the stock market is in an objectively identified up trend (i.e., close above 200-day moving average) we will attempt to press our advantage by using 2-to-1 leverage.   When the S&P 500 is below its 250-day moving average we will eschew the use of leverage.

The results for this test appear in Figure 3. jotm20131213-03Figure 3 – Growth of $1,000 invested in S&P 500 after 3 (or more) consecutive down closes using 2-to-1 leverage if S&P 500 > 250-day moving average (December 1987 to present)

Using this approach $1,000 grew to $35,868, or +3,469% (albeit with a maximum drawdown of -20.2%).

 Funds to Use

Mutual Fund: Profunds ticker BLPIX (S&P x 1)

Mutual Fund: Profunds ticker ULPIX (S&P x 2)

ETF: Ticker SPY (S&P 500 x 1)

ETF: Ticker SSO (S&P 500 x 2)


Summary

Does this simple method represent the “Holy Grail of Trading?”  Of course not.  Is it even better than whatever system you are using right now?  I can’t answer that, only you can.  But the main point here is simply to note that dips in the stock market – even in the face of an overall downtrend – tend to be buying opportunities (at least in the short run).

The simple rules presented here represent just one way to exploit this fact.

Jay Kaeppel

Mea Culpa re Growth versus Value

It’s Mea Culpa Time.  In my article on November 12th, titled “When to Value Value”, I made a mistake that I still cannot believe I made.  Even now.  Anyway, first the Good News.

The Good News is that none of the performance numbers listed in the article change.  So the system still remains a meaningful improvement versus buy-and-hold.

Here’s the Bad News: When I noted which price data series was being used when a long position was taken, I somehow got it in my head that it was taking price data from the “Value” column.  It was not.  The price data used during long positions come from the “Growth” Column.

In other words, the article should rightly be titled “When to Value Growth”.  So to be clear (for a change), when the calculated value in question is negative, an investor would hold GROWTH stocks (NOT VALUE stocks).

My thanks to an alert reader who tried to replicate my results and got way different numbers and alerted me to his findings.  After reviewing things I finally realized my error.

I apologize for any inconvenience.

The link to the corrected article:

http://jayonthemarkets.com/2013/11/12/when-to-value-value/


Your Friend, the Trend

2013 Market Year in Review   

The analysis is actually pretty simple:

Stocks:

Financial, World and Economic News: BAD

Stock Market Performance: GREAT!

Bonds:

Investor A: Hey, have you noticed that t-bond yields have hit a 15 month high? Investor B: What, me worry?

Gold:

Ppppppphhhhhhhhttttttt!

So it is pretty obvious at this point that stocks were the place to be in 2013 (which is maybe why the Investors Intelligence poll registers just 14% bears).   Of course, no one is ever content with that kernel of knowledge.  We want to know what’s going to happen in the future.  In fact the investing public is so hungry for “advance” knowledge that there are now thousands of pundits out there offering all kinds of wildly differing opinions.

So all the investor has to do is decide which opinion they “want to believe”, find a pundit offering that opinion, and “Voila” – they have “expert confirmation” that their opinion is “correct.”

And so it goes, and so it goes.

Meanwhile, back here in reality land, a simple trend-following approach can reap many benefits, especially when the following mantra is true for the stock market:

“If the Fed is pumpin’, the stock market’s jumpin’.”  Period.  End of analysis.


The Right Way and the Wrong Way to Look at Trend Following Methods

There is a right way and a wrong way to look at trend-following indicators:

The Wrong Way: “Wow, my handy dandy trend following indicator is bullish at the moment, therefore I can extrapolate this out to mean that this bullish trend will continue for some time to come.”

The Right Way: “Well, the trend is up at the moment, but of course this could change at any moment, so while I won’t panic and sell everything as long as the trend is still up, I will check back often and if the trend changes I will change my thinking and actions accordingly.”

The most important thing to remember about trend-following indicators is this:

-There is no “prediction” built into the current reading

In other words, a trend-following method does nothing more than identify the current trend right now.  Tomorrow is a different day.  While this may not “sound” as useful as some fancy indicator that portends to be able to predict the future, in reality it is actually much more useful.

Likewise, also remember that there is no humanly possible way to eliminate occasional whipsaws when using moving averages.  So learn to live with it.


Trend-Following Indicators I Have Known and, er, Followed(?)

None of the indicators or methods that I will discuss next will ever pick a bottom or a top.  In fact, they may not even really impress you in any way.  At least not until you find yourself on the sidelines while the market is powering higher without you on board.  So here are a couple of simple trend-following indicators to keep in mind:

The 200-day Moving Average

OK, this one is so basic and so commonly followed that it gets dismissed by some people.  But Figure 1 displays a variety of markets during different time frames.  In fact, an investor who simply fought the urge to fight the trend would have enjoyed riding some nice uptrends (particularly in the stock market) and avoided a lot of pain (most notably in bonds and gold). jotm20131210-01Figure 1 – Four Markets with 200-day simple moving average  (Courtesy: AIQ TradingExpert)


The Bowtie Pattern

I learned the Bowtie pattern from David Steckler (http://www.etfroundup.com/), who in turn learned it from David Landry (www.davelandry.com).  It involves three moving averages:

-10-day simple moving average

-20-day exponential moving average

-30-day exponential moving average

A Bullish signal occurs when the 10-day is above the 20-day and the 20-day is above the 30-day.

A Bearish signal occurs when the 10-day is below the 20-day and the 20-day is below the 30-day.

As usual, different traders use things in different ways.  David likes to enter as soon as a new trend emerges, I prefer to look for pullbacks within an established trend.  I suggest you explore both possibilities. 20131210-02 Figure 2 – Four Markets with 10-day simple, and 20 and 30-day exponential averages  (Courtesy: AIQ TradingExpert)


The 13-55 Exponential Moving Average

OK, at some point one moving average method looks pretty much like every other moving average method.  In fact that is actually the case.  Linda Bradford Raschke of Market Wizards fame (www.LBRGroup.com) once stated (OK, for the record, I am paraphrasing here)  that “there is no one best moving average method, so just pick something and go with it.”

One more combination that I like as an intermediate term guide is the 13-day and 55-day exponential moving average combination as shown in Figure 3.

20131210-03 Figure 3 – Four Markets with 13-day and 55-day exponential averages  (Courtesy: AIQ TradingExpert)

Summary

I encourage you to take a closer look at all of the combinations I’ve mentioned above.  Remember two things:

-If you try to use them as Standalone systems (i.e., buying at every bullish signal and selling at every bearish signal) you are likely to be disappointed.

-The real power comes from using methods like the ones I’ve shown to objectively identify the current major trend, and then figuring out ways to trade in line with the major trend.

Jay Kaeppel

A Simple VIX Hit-and-Run Method

In my recent MTA webinar (http://go.mta.org/watch112013), I emphasized the point that there has never been a better time to be a trader.  The number and variety of opportunities available is fairly amazing.  So let’s take a look at another trading opportunity that was not available at all not that long ago.

Here are the Trigger rules:

-VIX Index <=20

-(VIX Index close – VIX Index 10-day moving average) is greater than or equal to 3.00 points

-(VIX Index close – VIX Index 10-day moving average) then declines for one day (i.e., the gap is less than the value yesterday and yesterday’s value was +3.00 points or more).

When this happens:

– Buy a put option on ticker VXX using the following guidelines:

-At least 40 days left until expiration

-The highest Gamma among near-the-money puts

Hold until:

The 4-day RSI for the VIX Index itself drops to 30 or below.

For the record, this strategy has an extremely limited track record, so I would not be too quick to jump on board.  Still the results are promising.

Figure 1 displays ticker VIX with some signal dates noted. jotm20131204-01Figure 1 – VIX Index (Courtesy: AIQ TradingExpert)

Figures 2, 3 and 4 display the most recent VXX trade signaledjotm20131204-02 Figure 2 – VXX high Gamma puts (Courtesy: www.OptionsAnalysis.com)

jotm20131204-03Figure 3 – VXX Put trade (Courtesy: www.OptionsAnalysis.comjotm20131204-04Figure 4 – VXX Put trade (Courtesy: www.OptionsAnalysis.com)

 Results

Figure 5 displays the hypothetical results (note no deductions for slippage and commissions) assuming that $2,500 was committed to each trade.  Also note that it is possible to have more than one trade on at a time. jotm20131204-05Figure 5 – Hypothetical Results 2012-2013

Summary

Again, this is a very limited track record.  Also, because this method looks at the raw number of points between the VIX close and it’s 10-day moving average (rather than a percentage difference) it is probably only useful when the VIX is at a relatively low level (i.e., below 20).

But it does provide one more potentially useful arrow in the quiver for an alert trader.

Jay Kaeppel


Floating With the Modified Butterfly Spread

Today I want to highlight an option trading strategy that relatively few traders ever consider.  This strategy is known as the “Modified Butterfly”.  Since I am not entirely sure who coined that phrase I will give credit to John Broussard, the developer of www.OptionsAnalysis.com, the software I use for my own options, well, analysis.

(Please view my free “Finding Exceptional Opportunities” webinar at http://go.mta.org/watch112013)

The “classic” butterfly spread involves buying one in-the-money call (or put) option, selling two at-the-money call (or put) options and buying one more out-of-the-money call (or put) option.  An example of a “classic” butterfly spread appears in Figure 1, and the basic idea is to be able to make money of the underlying security remains within a particular price range. jotm20131202-01 Figure 1 – The “Classic” Butterfly Spread (Courtesy: www.OptionsAnalysis.com)

The problem with the “classic” butterfly is twofold:

1) If the underlying security makes a meaningful move in either direction you are out of luck.  For the record, I have found it just as difficult to predict when something “is not going to move” as it is to predict when something “is going to move.”  (In fact, early in my career, whenever I would put on a “neutral” strategy such as a butterfly spread or a calendar spread, it would invariably act as some sort of cattle prod to the underlying stock itself, and the quietest, sleepiest, most boring stock in the world would suddenly burst from the gate like a bat out of you know where).

2) Logistically you can run into the “inconvenience” of finding yourself long one in the money option, short two in the money options and long one out of the money option on expiration day.  If you hold this position through the close of option expiration day you end up on the following Monday with a position of short 100 shares of stock.  Surprise!  And not the pleasant kind for the unsuspecting.

The Modified Butterfly is essentially an attempt to put the odds slightly in your favor and to collect some option premium.

The Modified Butterfly (heretofore MB)

For the record, when the S&P 500 Index is above its 200-day moving average I prefer to look for MB’s using put options and when the S&P 500 Index is below its 200-day moving average I prefer to look for MB’s using call options.

Figure 2 displays an inputs screen from www.OptionsAnalysis.com for Modified Butterfly spreads on 11/4/13.  In a nutshell, we are:

-Buying 1 out-of-the-money put option

-Selling 3 puts at a lower strike price

-Buying 2 more puts at an even lower strike price

The ultimate goal of the trade we will find is for the stock to do anything expect decline sharply (i.e., rally, stay relatively unchanged, or drop only a little) and to keep the premium we collected when the trade was entered. jotm20131202-02Figure 2 – Modified Butterfly Inputs  (Courtesy: www.OptionsAnalysis.com)

Figure 3 displays the output.  This list is sorted by % Probability of profit.  jotm20131202-03Figure 3 – Modified Butterfly Output Screen  (Courtesy: www.OptionsAnalysis.com)

On the far right hand side you can see that a trade using SPY options has an 85% probability of profit.  However, two columns over to the left we see that the credit taken in on this trade is only 0.3%.  In a nutshell, we are risking $3,638 in order to make a profit of $12.  In my book, this is not enough profit potential to justify taking the risk.

Ideally, I want to see:

-Probability of Profit >= 75%

-Near P/L / Maximum Risk >= 5%

-Days to option expiration <=14

-No earnings announcement due prior to option expiration

In sum, I prefer to look for the opportunity to make at least 5% in 14 days or less with at least a 75% probability of profit and no impending earnings announcement that could upend the stock.

Further down in Figure 3 we find a trade using put options on AMZN that meets these criteria.  This trade risks $2,345 and takes in a credit of $155.  This represents a 6.6% potential return in just 11 calendar days. jotm20131202-04

Figure 4 – AMZN Modified Butterfly  (Courtesy: www.OptionsAnalysis.com)

jotm20131202-05 Figure 5 – AMZN Modified Butterfly  (Courtesy: www.OptionsAnalysis.com)

As you can see, this trade will make money as long as AMZN stays above $351.73.

A few things to note:

-The basic goal is for the stock to not plummet in which case we simply keep the credit taken in when the trade was entered.

-However, because the downside risk is greater than the profit potential this IS NOT a “set it and forget it” type of strategy.  In other words, you need to think about in advance how you will react and what steps you will take if the stock starts to fall hard and the trade starts to accumulate a loss – especially if it reaches or exceeds the breakeven price.

-There is additional upside potential if the stock happens to be between the two lower strike prices at expiration.

-The biggest risk for a trade like this is “the huge gap down.”  Hence the reason I want to be sure there is no earnings announcement due prior to option expiration.  Likewise we are looking for a trade with no more than two weeks left until expiration so as to minimize the amount of time we are at risk.

As you can see in Figure 6, between 11/18 and 11/29 AMZN rallied sharply so all the legs of this trade expired worthless and the initial credit was kept as a profit.jotm20131202-06Figure 6 – AMZN stays above breakeven price of $351.73 (Courtesy: AIQ TradingExpert)

Summary

Traders and investors looking for an “income generating” strategy using options might do well to take a closer look at the Modified Butterfly spread.  If done right and managed properly this strategy can generate a series of relatively small profits that accumulate nicely over time.

The one “real world of trading” caveat to keep in mind is this: This is one of those strategies where one unmanaged losing trade can wipe out a lot of small profits garnered along the way.  So the two keys to success with this strategy are:

1) Follow the guidelines listed earlier to focus on the best opportunities

2) Develop a “fail safe” plan for each and every trade so that you are prepared when the “outlier” occurs (because eventually it will)

Jay Kaeppel