Monthly Archives: June 2016

The World is Your Oyster – 4 Days a Month

Some things are just plain hard to explain.  I did the following test using all 17 of the iShares single country funds that started trading 1996:

I tested the performance of each single country ETF on each specific trading day of the month (i.e., the 1st trading day of any month is TDM 1, the next day is TDM 2, etc.)

I also examined the last 7 trading days of the month counting backwards (i.e., the last trading day of the month is TDM -1, the day before that is TDM -2, etc.)

(See also Wild-Eyed T-Bond Speculation (Sort of))

The basic idea was to see if there were any consistently favorable or unfavorable days of the month.  I wasn’t necessarily expecting much given that the stock markets of each of 17 different countries could  rightly be expected to “walk to the beat of their own drum”, given that the fundamentals underlying the stock market in any given country may be unique from that of other countries.

Or maybe not so much.

For what it is worth, the results from 3/25/1996 through 6/20/2016 appear in Figure 1.

(click to enlarge)1Figure 1 – Trading Day of Month Results for 17 iShares single country ETFs; 3/25/96 through 6/20/16

Each column displays the cumulative % return for each individual single country ETF if we held a long position in that ETF on only that particular trading day of the month.

As you can see – and what are the odds of this, I am not even sure how to calculate that – there are 4 days (highlighted in green in Figure 1) that were uniformly “favorable”, i.e., all 17 ETFs showed a net gain on that particular trading day of the month (for the record, there are three trading days – TDM #7 and TDMs -7 and -6 – during which all  17 ETFs showed a net loss (highlighted in yellow in Figure 1.  Go figure).

Using as a Strategy

I am not recommended the following strategy, but wanted to test it out for arguments sake.  Figure 2 displays the results of the following test:

*Buy and hold an equally weighted position in all 17 single country ETFs only on TDM 1, 9, 13 and -4 (i.e., if Friday is the last trading day of the month then – barring a holiday – TDM -4 would be the Tuesday of that week), earn annualized interest of 1% per month while out of ETFs.

*Versus simply buying and holding all 17 single country ETFs from 3/25/1996 through 6/20/2016.

2Figure 2 – Cumulative % return for holding all 17 single country ETF only 4 days a month (blue) versus buying and holding (red); 3/25/96 through 6/20/16

Summary

Yes, this model can probably be accused of being “curve fit”.  Also, does anybody really want to trade in and out of 17 single country ETFs 4 times a month?  I don’t know.  But the bigger points are:

*Why would all 17 single country ETFs all be up (or down) on a particular day of the month over a 20 year period?

*If I were considering buying and holding a cross section of individual country ETF’s, um, well, I can’t help but think that I would be haunted by the thought that there might be a better way.

Jay Kaeppel


Not the Time to Be a Hero in Natural Gas

Since its early March low, natural gas (using the ETF ticker UNG as a proxy) has rallied +37% to a June high of $7.95 a share.  Not bad.  And as the advance has continued I read more and more bullish prognostications for higher prices still.  Human nature seems to dictate that the further an advance extends the more bullish people become.  Which leads us directly to:

Jay’s Trading Maxim #306: Human nature can be a detriment to trading success and should be avoided as much as humanly possible.

(See also Wild-Eyed T-Bond Speculation (Sort of))

Figure 1 displays the current status for ticker July natural gas futures.  Note the obvious overhead resistance point at $2.63-$2.64.1Figure 1 – Overhead resistance for natural gas futures (Courtesy ProfitSource by HUBB)

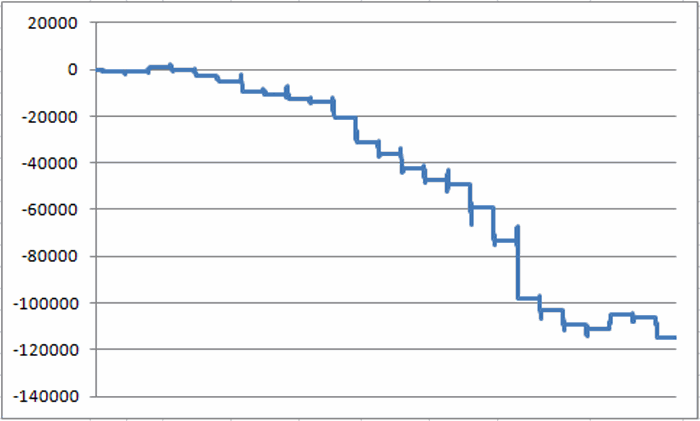
In addition, we have entered a seasonally unfavorable period for natural gas at the close on 6/15 (June Trading Day #11).  This unfavorable period extends through 7/21/16 (July Trading Day #14).  Figure 2 displays an equity curve generated by holding a long position of one natural gas futures contract during the June TDM #11 through July TDM#14 since 1990.2Figure 2 – Long 1 natural gas futures contract June TDM #11 through July TDM #14; 4/4/1990-Present

By no means a bearish “sure thing”, but not a very pretty picture in any event.

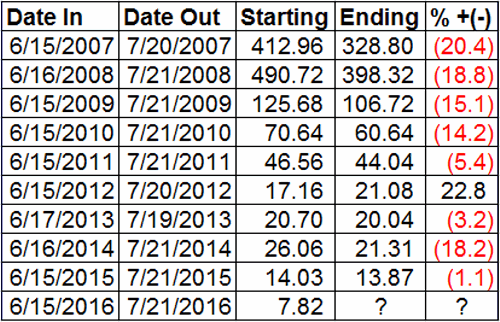
The performance of the ETF ticker UNG during the “unfavorable” time frame appears in Figure 3.

3

Figure 3 – UNG performance during “seasonally unfavorable” June/July time period

Summary

So does any of this guarantee that natural gas is sure to decline in price between now and late July?  Not at all.  Should you sell short as much natural gas as possible?  Not necessarily.

But as the title implies – while natural has could certainly break out above recent resistance and surprise to the upside (see 2012 results in Figure 3) – I can think of other things to do with my money for now.

Jay Kaeppel

Wild-Eyed T-Bond Speculation (Sort of)

T-Bonds have had a heck of a run.  Whether you are talking about the last 6 months, the last 5 years or the last 3 and half decades, bond prices have a come a long way.  At the moment t-bonds are threatening to break out and run again to the upside.  Given that my crystal ball broke a long time go and that I am not very good at predictions, I am not about to say anything stupid like “this is the top”, or “sell everything” (in terms of bond holdings).

But I am reasonably good at weighing potential risk versus reward.  Given this – while I am not making a specific recommendation – it may be possible to play the bearish side of bonds in the very short-term.  But first, something completely illogical

Japanese Stocks vs. Bonds

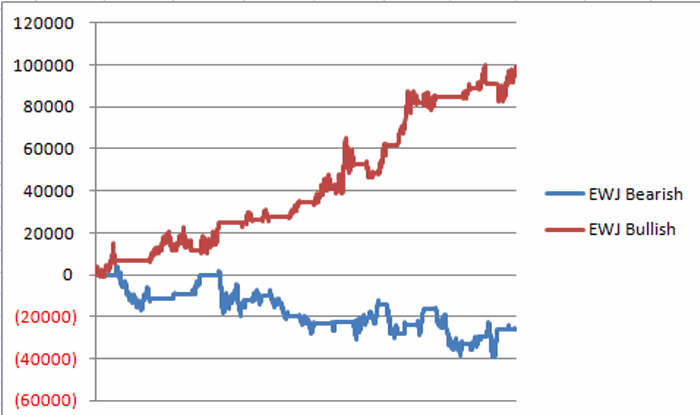
I have written in the past about the long-term inverse relationship between Japanese stocks and long-term U.S. treasury bonds (no, seriously).  For the record the crude “timing” method that I use just gave a “sell” signal for bonds.  Also for the record, the model I use is far from perfect so the fact that it just issued a bearish signal doesn’t necessarily mean that bonds are sure to take in the near future.  Still, Figure 1 displays the equity curve for holding long one t-bond contract during those times when the model was bullish versus when the model was bearish since 1997.1Figure 1 – Long 1 T-bond futures if Jay’s EWJ indicator is bullish (red) or bearish (blue); 12/31/1997-present

Far from perfect but clearly there seems to be something “there”.

Figure 2 displays the latest weekly bar chart for ticker EWJ (which tracks the Japanese stock market).  A sell signal for t-bonds occurred when the 5-week MA rose above the 30-week MA as of 6/10/16.2Figure 2 – Weekly ticker EWJ with 5-week and 30-week moving averages (Courtesy AIQ TradingExpert)

Current Bond Picture

In Figure 3 you can see pretty much whatever you want to see.  Some will see a bond market that is breaking out to the upside (and with rates around the world trending toward negative numbers, why not?).  Others may see a market that is extremely overbought short-term, is struggling to move past one resistance level and has another significant resistance level looming at $138.50.3Figure 3 – What do you see in TLT? (Courtesy AIQ TradingExpert)

So based on Figures 1, 2 and 3 should we:

*Do nothing?

*Enter a bullish position to profit from a potential upside breakout?

*Sell short every t-bond futures contract we can get our hands on?

*Or something else?

Let’s consider each more closely.

Do Nothing

That is always the easiest (and lowest risk) approach.  It would be perfectly logical to remain patient here and wait to see if bonds breakout to the upside or bump solidly against resistance before deciding on a course of action.

Enter a bullish position to profit from a potential upside breakout

A trader looking for an upside breakout might consider the example bull call spread shown in Figure 4. 4Figure 4 – Aug TLT 135-140 Bull Call Spread (Courtesy www.OptionsAnalysis.com)

This position risks $182 with a maximum profit potential of $318 if TLT is at or above 140 by August 19th.

Sell short every t-bond futures contract we can get our hands on?

If one truly believes that the 138.50 resistance level will hold and that “this is the top” for bonds then this strategy might make sense.  It is also a risky strategy and not “my cup of tea”.  So I will leave this idea alone.

Something Else?

If your outlook is “Given the sell signal from respectable long-term indicator, the fact that t-bonds are very overbought right now, and there is another key resistance level above, is it possible that t-bonds will pause here for a little while”, then you might consider the following example trade.

*Sell 3 July Week 1 TLT 137 call options @ $1.50

*Buy 3 July Week 1 TLT 145 call options @ $0.19

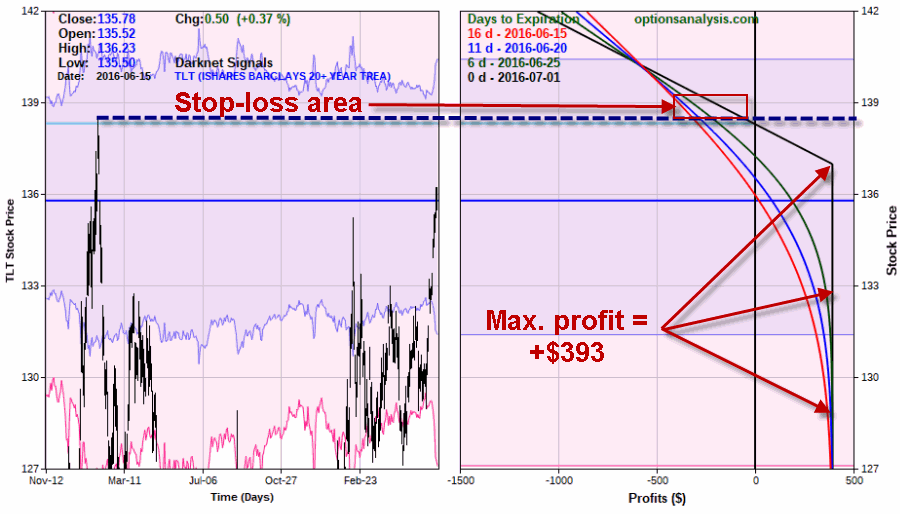
For planning purposes we will resolve to exit this trade if TLT moves above the previous high of $138.50 established on 1/30/2015.  We might use a stop-loss point of $138.50 to $138.80 or TLT shares.  The trade particulars appear in Figures 5 and 6.4Figure 5 – TLT July Weeek 1 bear call credit spread (Courtesy www.OptionsAnalysis.com)5Figure 6 – TLT July Weeek 1 bear call credit spread risk curves (Courtesy www.OptionsAnalysis.com)

Under this scenario this trade will:

*Make money if TLT remains below $138.31 for the next 16 days.

*Earn the maximum profit of $393 if TLT is below $137 at expiration (July 1st)

*Lose somewhere between -$150 to $-360 if TLT hits $138.80 prior to expiration (depending on how soon the stop-loss price is hit) and we stop ourselves out.

Summary

The trades above are not recommendations.  The bull call spread will lose money if t-bonds fail to rally between now and 8/19.  The bear call credit spread serves as an example of one way to use options to potentially make money if an overbought security “cools off” for a short period of time.  For the record, I got burned on this type of trade recently (here and here), so one might be hesitant to “touch the hot stove” again.  But that is exactly the wrong approach to trading.  Each opportunity is its own independent event and what happened “last time” should not color one’s thinking when evaluating the next opportunity.

So will this example get torched like the last one?  It’s possible.

Hence the reason for a stop-loss order.

Jay Kaeppel

To the Silver Well One More Time

There has been a lot going on in the silver market in 2016, as I have written about here, here, here, here, here , here, here and here.

And of course, um, here.

In my last silver post I introduced a quirky strategy that buys a closer-term (September) at the money call option and sells a longer-term (January 2017) far-out-of-the-money call option.  Since that time silver has advanced nicely and the trade has generated a decent profit.

One of the great advantages associated with trading options is the potential to “adjust” trades in order to lock in a profit.  So let’s look at one potential example based on the original trade of:

*Buying 11 SLV September 15 calls

*Selling 11 SLV January 20 calls

The current status of this trade appears in Figure 1 (click to enlarge)1Figure 1 – Original SLV Long Sep 15 / Short Jan 20 position (Courtesy www.OptionsAnalysis.com)

Now let’s consider the following adjustments:

*Sell 11 SLV September 15 calls

*Buy 10 SLV January 20 calls

*Buy 2 SLV January 18 calls

The new position appears in Figures 2 and 3 (click to enlarge)2Figure 2 – Adjusted SLV trade (Courtesy www.OptionsAnalysis.com)

(click to enlarge)3Figure 3 – Adjusted SLV trade risk curves (Courtesy www.OptionsAnalysis.com)

The net effect is:

*The trade for up to 7 months (January 2017 expiration rather than just through September expiration)

*The worst case scenario is a profit of $196

*The trade (by virtue of being long 2 18 strike price calls and short only 1 20 strike price call) still enjoys unlimited profit potential is silver decides to go crazy on the upside.

Is this a good idea?  Only time will tell.

Jay Kaeppel


Now let’s consider the following adjustments:


Sell 11 SLV September 15 calls

Buy 10 SLV January 20 calls

Buy 2 SLV January 18 calls


The new position appears in Figures 2 and 3:


Figure 2


Figure 3


The net effect is:


The trade for up to 7 months (January 2017 expiration)

The worst case scenario is a profit of $196

The trade (by virtue of being long 2 18 strike price calls and short only 1 20 strike price call) still enjoys unlimited profit potential is silver decides  to go crazy on the upside.


Jay Kaeppel


The Importance of Respecting Your Stop

Sometimes as a trader or investor you come across an idea that seems perfectly reasonable.  Based on sound theory, perhaps some real world experience to back it up, a decent probability of making money and of course a stop-loss – or “uncle” – point to keep any potential risk at a reasonable level.

Like I said, it all sounds perfectly reasonable.

And then it all goes to hell.

Welcome to the exciting world of trading and investing.  If you have been in the markets for any length of time you probably know what I am talking about (“Hi, my name is Jay”).  And sometimes, just to compound the “palm of hand to forehead effect”, it all goes to heck beginning almost immediately after the moment you make your move.  Guess what, it happens.  And it sucks.  And it hurts.  And it embarrassing, infuriating, it shakes your confidence and it costs you money.

And – repeating now – it happens.  So the only question that really needs to be asked and answered is “did you limit your loss to an acceptable amount?”

(See also Jay’s Trading Maxim’s (Part 1))

But here is what you really need to know:

*Too often people let this scenario shake their confidence on the next trade

*Too often people dwell on the “how could I be so stupid” effect

*Too often people change what they are doing based on one bad trade – which ultimately costs them more money down the line

*And way, way too often people do not respect their stop-loss point – typically because they don’t want to be proved to be so horrifically wrong (“maybe it will turn around if I just give it a little longer”).  Which is exactly how one bad trade can derail even the most diligent trader or investor.

So here is what you really need to remember:

*First adopt a sound investment plan/method in which you have confidence

*Trust your analysis but also recognize and accept that bad things can happen at any time

*Follow your investment plan

*Always (always, always) respect your stop-loss points

More on this last point.  On 6/1 I wrote a piece detailing a step-by-step process for finding what I call “Credit Spreads in Summer”.  It is a very logical process based on sound theory (the market long-term tends to struggle during the summer months, selling call credit spreads on overbought stocks during this time has a high potential for success, the trade I highlighted had about a 1-to-1 reward-to-risk ratio- which is good for a credit spread, etc.)

The trade I highlighted involved selling a bearish call credit spread on ticker LULU.  It looked pretty good to me.  But here comes the key part of this article:

*The key premise to making this trade was that the trader must be willing and able – financially and emotionally – to risk roughly $800.  If losing $800 – whatever the circumstance, however that loss came about – was something that might cause a crisis of confidence or affect your trading going forward then the trade should not have been taken.

And then it all went to hell.

On 5/27 LULU closed at $64.69 a share.  Our stop-loss point was above the recent high of $69.73.  It took just 7 short trading days for LULU to zoom straight past the stop-loss point and close at $71.48.1Figure 1 – LULU credit spread goes immediately wrong (Courtesy www.OptionsAnalysis.com)

Getting stopped out when LULU broke about $69.73 would have resulted in a loss of roughly -$800.  Which is exactly what one had to be willing and able to risk at the time the trade was entered.

So (at least in theory) in the whole big spectrum of things, this trade was just “a cost of doing business” and should already be forgotten.

But that is not the way most people’s mind works.  A more typical response might be:

“I should find a better way to identify bearish credit spreads”

“Maybe I should trade bearish credit spreads at all”

“I cannot believe I got stopped out in just 7 days”

“I am so embarrassed that I posted an article that ended up being such a bad trade”

“Maybe next time I will use a really tight stop so I don’t lose as much money”

And so on and so forth.

The Whole Point

The thoughts in quotes above are what leads people down the wrong path.  The quotes below represent the way successful traders think:

“The decision to risk $800 was made”

“Action was taken”

“$800 was lost”

“A cost of doing business was incurred”

“Move on to the next trade”

One Final Point

Note that if a trader in this trade had not respected his or her stop-loss point (and exited with a loss of $800), by the end of the day on 6/8 he or she would have been sitting with an open loss of -$1,314.

Is it possible that this trade “left to run” might still end up showing a profit?  Absolutely.  Or it could into an even larger loss.

The successful trader has already cut bait and moved on.

Here ends the (albeit, painful) lesson.

Jay Kaeppel


Take These Days of the Month Off, Make More Money

In my book “Seasonal Stock Market Trends” I devote an entire section to “Trading Days of the Month.”  This article borrows from and updates some of the information in that section.

Defining “Trading Days of the Month” or TDM

A “trading day” is simply a day when the U.S. stock market is open for business.  Most months have between 19 and 22 “trading days”.  For counting purposes I refer to the first trading day of the month as TDM 1, the next as TDM 2 and so on and so forth.

As you will see, it can also be useful to count backwards.  In other words, the last trading days of the month is referred to as TDM -1, the second to last day as TDM -2 and so on.

Days of the Month to Avoid

Based on a test using the Dow Jones Industrials Average starting on 12/31/1933 the trading days best avoided are:

*TDM 5 and 6

*TDM 13, 14, 15 and 16

*TDM -7, -6, -5

*Note that there is often overlap between TDMs 13 through 16 and TDMs -5, -6 and -7.  In other words for a given month TDM 16 and TDM -6 may be the same day.  This simply counts as one day to be avoided.

Results

Now I will grant you that exiting and re-entering the market twice a month seems like a lot of bother.  Still, the results are worth considering.  Figure 1 displays the, ahem, growth of $1,000 invested in the Dow Jones Industrials Average only on the TDMs listed above (i.e., #’s 5, 6, 13, 14, 15, 16, -7, -6,-5) since 12/31/1933.1Figure 1 – Growth of $1,000 invested in Dow Jones Industrials Average ONLY on TDM #’s 5, 6, 13, 14, 15, 16, -7, -6,-5); since 12/31/1933

Anyone notice a trend?  For the record, since 1933 the original $1,000 declined in value -91% to just $87.  Before you start yelling “curve-fitting” please note in Figure 1 that the downward trend has been very persistent for many decades.  In fact 87% of all 10-year rolling returns have showed a loss.

So what does one gain by skipping these “unfavorable” days of the month?

Figure 2 displays the growth of $1,000 using buy-and-hold (red line) versus holding the Dow only during all of the “other” (i.e., NOT unfavorable) trading days of the month (blue line).2Figure 2 – Growth of $1,000 invested Dow Jones Industrials on all TDM EXCEPT #’s 5, 6, 13, 14, 15, 16, -7, -6,-5 (blue line) versus buy-and-hold (red line); since 12/31/1933

For the record, since 12/31/1933:

*$1,000 invested during all “unfavorable” days declined to $87 (-91%)

*$1,000 invested using buy-and-hold grew to $179,562 (+17,856%)

*$1,000 invested during all “unfavorable” days declined to $2,062,769 (+206,177%)

The difference between +206,177% and -91% is what we “quantitative analyst types” refer to as “statistically significant.”

(See also An Interesting Article I Think You Should Read)

Jay Kaeppel


An Interesting Article I Think You Should Read

I read this article by James Altucher titled “Why the Economy is Totally Screwed. And How You Can Make Money Off of it Today.”

I am always leery of “predictions”, especially long-term.  I have no idea if this author is spot on or will ultimately be shown to be way off base (to the author’s credit he writes explicitly, “And nobody can predict the future.”).  But I sure found this article to be an extremely interesting read.

I am guessing you will too.  So go ahead, take a chance……and read it.

(See also Health Care Monthly Meds)

Jay Kaeppel

Another SLV Setup?

As I have written about here, here and here, it’s not been a bad year to be bullish on silver.  There is some evidence to suggest that the big “jump” on 6/3 may be a sign of still more bullish things to come (although – as I also wrote about here and here we are still in something of a potential “danger zone” through 6/25).

The purpose of this blog is not to make recommendations but to pass along “ideas” and also to educate traders and investors regarding how to look at the markets in unique ways in order to (hopefully) learn to spot unique opportunities.  So let’s take a closer look at an “idea” for silver.

Elliott Wave

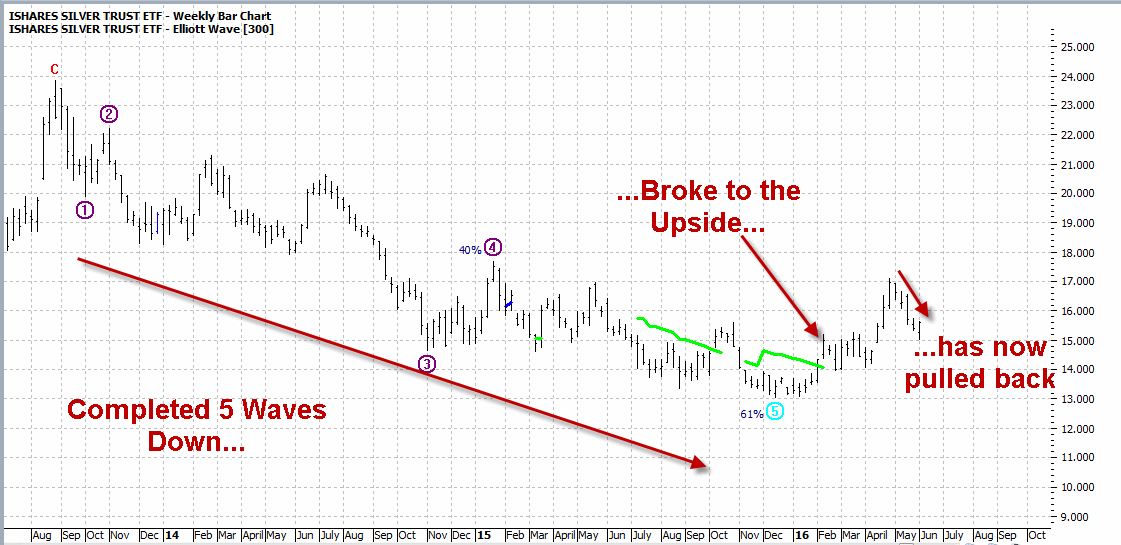
When it comes to Elliott wave analysis, for the record I am not a full-fledged “Elliott Head”.  Typically I am only interested when the weekly and daily Elliott Wave projections (I use ProfitSource by HUBB to view these) are either both bullish of both bearish. Figure 1 displays the weekly count for ticker SLV (the ETF that tracks the price of silver).  As you can see, it:

*Completed a 5-wave pattern down

*Broke to the upside

*And has since pulled back (in theory setting the stage for another move up)

(Click to enlarge)1aFigure 1 –Weekly Elliott Wave count for ticker SLV (Courtesy ProfitSource by HUBB)

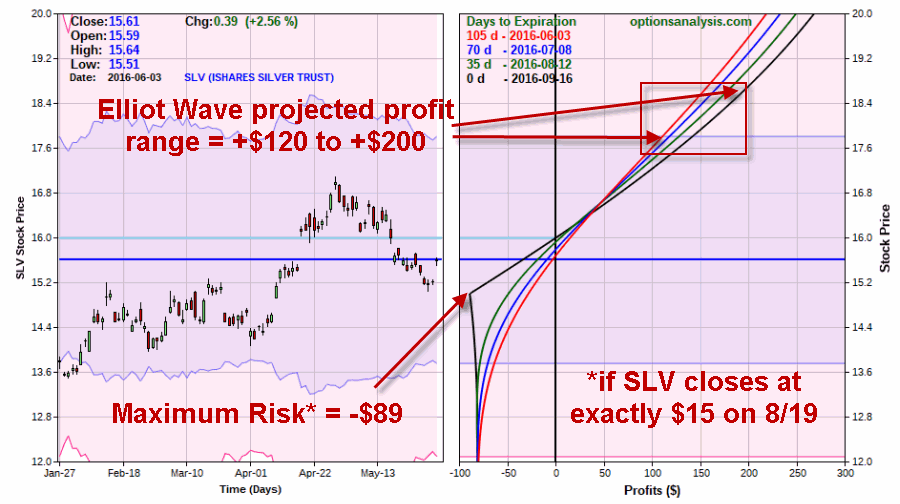
Figure 2 displays the daily count for SLV.  As you can see the 6/3 advance broke above the Elliott Wave signal line and could be the start of a new Wave 5 advance. The projected target range is $17.70 to $18.64.

(Click to enlarge)1Figure 2 – Daily Elliott Wave count for ticker SLV (Courtesy ProfitSource by HUBB)

Important Note: These “projections” are just that. Sometimes these things work out great and sometimes they don’t. No one should assume that this is some sort of “sure thing.”  The real question is “Are these weekly and daily EW counts and projections enough to compel you to act?”

If your answer is “No”, then please feel free to stop reading (but thank you for staying with me this far and please check back soon).

If your answer is “Yes”, “Maybe”, “I dunno” or “What kind of action did you have in mind?” then let’s look a little closer.

Implied Option Volatility

The most straightforward action for a person who is bullish on SLV is to buy 100 shares of SLV at $15.61 for $1,561.  But there are less costly alternatives.  One possibility is to buy a call option on SLV.  However, before buying a call option on any security it is helpful to know whether the ”implied volatility” for options on that security is presently high or low.  Without getting into a long explanation let’s just say that if implied volatility is “low” then the options will cost less to buy (because there will be less “time premium” built into the price) and if implied volatility is “high” then the options will cost more to buy.

As you see in Figure 3, the IV for SLV options is presently neither high nor low but rater somewhere in the middle.  So based on this we are going to consider an alternative strategy to simply buying a call option.

(Click to enlarge)2Figure 3 – Implied volatility on SLV option “in the middle” (Courtesy www.OptionsAnalysis.com)

A closer look at Figure 2 reveals that the Elliott Wave projection range of $17.70-$18.64 extends through late August.  This suggests that we should look out to at least September options. So we will look to buy the slightly in-the-money September 15 strike price call option.

Also, because IV is not “cheap” we will look to offset some of the cost of the option we buy by selling something.  In this example we will sell the January 2017 20 strike price call.  The particulars for this trade appear in Figure 3 and the risk curves in Figure 4.

(Click to enlarge)3aFigure 3 – Long Jul SLV 15 call / Short Jan 20 call (Courtesy www.OptionsAnalysis.com)

(Click to enlarge)4aFigure 4 – Long Jul SLV 15 call / Short Jan 20 call risk curves (Courtesy www.OptionsAnalysis.com)

Things to note:

*The worst case scenario: SLV closes at exactly $15 a share on September 16th (Sep. option expiration date). In that scenario the trade will show a loss of -$88.90 (and technically we would be short one January 20 call, so we would need to either close out that position or buy another long call to cover the short January 20 call. If we do nothing we will be short a naked call which involves margin requirements and unlimited risk).

*If the Elliott Wave projections prove to be accurate: Then we should look to take a profit with SLV somewhere in the $17.70 to$18.64 range. Depending on the price for SLV and the amount of time it takes to get there our profit would likely be somewhere in the $120 to $200 range.

Summary

Is silver launching a new upleg? Maybe.  The weekly and daily Elliott Wave counts are suggesting that positive action maybe in store in the months ahead. That being said silver remains in an unfavorable seasonal period through the close on 6/25 so be forewarned that this “idea” may be a bit premature.

Still, the purpose of the trade detailed in this piece is not to serve as an immediate “call to action”.  The primary purpose is to illustrate one way to combine a variety of factors (Favorable Weekly and Daily Elliott Wave setups) and to figure out a low-cost way to take advantage of the situation (in this case by buying an in-the-money shorter-term call option while selling a far out-of-the-money longer-term call options in order to offset some of the cost

 Jay Kaeppel


One Example of the Summer Credit Spread

In this article I wrote about the tendency for the stock market to struggle during the summer months.  In this article I wrote about one way to use options to potentially take advantage of the fact that stocks tend to struggle during the summer.  Now in this piece I will walk through an example that we can follow through to conclusion.

Two key things to note:

1. The example presented here is an “example” and not a “recommendation”

2. If you are absolutely sure that you will never trade an option during your lifetime, you are dismissed from class early today (but Thank You for checking in and please be sure to come back soon)

The Summer Credit Spread

This example uses www.OptionsAnalysis.com.  The best endorsement that I can give this site is to say that, a) I use it for all of my own, um, option analysis (what else?) and, b) in the 90’s I helped write option software that was voted “Best Option Trading System” in Technical Analysis of Stocks & Commodities magazine 6 years in a row.  But when I started using OptionsAnalysis I stopped using my own software (Yes, it breaks my heart, but better is better).

Step 1: Heavily traded options with tight bid/ask spreads 

In OA go to Website | Lists | Filter Lists

I have set up a wizard with the settings shown in Figure 1.  The idea is to find stocks with option bid/ask spreads under 2% and average trading volume of at least 1,000 options a day.1Figure 1 – Filter List setup (Courtesy www.OptionsAnalysis.com)

Click “Search” to generate output results which appear in Figure 2.2Figure 2 – Filter List Output (Courtesy www.OptionsAnalysis.com)

In this example 141 stocks passed the filter.  Click “Replace” to save those 141 stocks to “My Stock List”

Step 2: 2-Day RSI of 90 or higher

Go to Stocks | Rankers | RSI

I have set up a wizard with the settings that appear in Figure 3.  The purpose is to find stocks from our filtered list that are short-term overbought.3Figure 3 – RSI Setup (Courtesy www.OptionsAnalysis.com)

The output results appear in Figure 4.  Note that 14 of the 141 stocks in “My Stock List” meet the RSI criteria.  Click “Replace” to save only those 14 stocks to “My Stock List”.4Figure 4 – RSI Output (Courtesy www.OptionsAnalysis.com)

Step 3: Look for Bear Call Credit Spreads

Go to Searchers | Multi – Strategies | Find Trades ++

I have setup a Wizard with the settings shown in Figures 5 and 6.5Figure 5 – Bear Call Credit Spread Settings (Courtesy www.OptionsAnalysis.com)6Figure 6 – Bear Call Credit Spread Settings

(Courtesy www.OptionsAnalysis.com)

From our list of 14 stocks we are looking for call credit spreads for:

*Stocks trading at $10 a share or higher

*A probability of profit of 75% or higher

*14 to 45 days left until option expiration

*A delta of less than 50 for the options traded (i.e., we will only consider out-of-the-money call options, i.e., those with strike prices above the current price of the stock)

Click “Search” to generate results

The output list appears in Figure 7.

7Figure 7 – Strategy Search Output (Courtesy www.OptionsAnalysis.com)

Step 4: Identify a Trade with Good Reward-to-Risk Ratio

Let’s take a closer look at the top rated trade which involves:

*Ticker LULU with the stock trading at $64.69 a share

*Selling the June 67.5 call

*Buying the 72.5 call8Figure 8 – LULU Jun 67.5/72.5 call credit spread details (Courtesy www.OptionsAnalysis.com)

Key things to note from Figure 8 (which assumes trading a 7-lot):

*The maximum profit potential is +$910 (+35.14%)

*The maximum risk is -$2,590

*The breakeven price at expiration is $68.80 (current stock price is $64.69)

*There are 21 days left until expiration

Figure 9 displays the risk curves for this trade with each colored line representing the expected profit or loss based on a given price on a specific date leading up to option expiration (the profit/loss at expiration is represented by the black line).9Figure 9 – LULU Jun 67.5/72.5 call credit spread risk curves (Courtesy www.OptionsAnalysis.com)

Step 5: Plan out Position Management

Now let’s look at this trade from a position management perspective.  If the stock starts to rally the last thing we want to do is sit around and wait to absorb the maximum loss of -$2,590.  So let’s set the recent high of $69.73 as our “line in the sand.”  If that price is taken out in any meaningful way we can justifiably say “we are wrong” and take our loss.

Figure 10 “zooms in” a bit from Figure 9.10Figure 10 – LULU call credit spread with a stop-loss point (Courtesy www.OptionsAnalysis.com)

As you can see in Figure 10, if we place a stop-loss point just above $69.73, and we exit if that price is hit then the expected loss is somewhere between -$800 and -$900, depending on how soon that price is hit.  While this is not an appetizing prospect, the point is that by placing a stop-loss above  the recent high we turn this trade from a 1-to-2.84 reward-to-risk ratio to roughly a 1-to-1 proposition, and the stock has to rally over 8% in three weeks to trigger our stop-loss.

And remember that this trade makes money at expiration if LULU is at any price below $68.60 at expiration.

On the profit-taking side, one might consider closing the trade prior to expiration if 80% to 90% of the maximum credit can be captured.  In this case that would mean taking a profit somewhere between $830 and $920 if such a profit becomes available prior to expiration.

Summary

So is this a “good” trade.  It depends on how you define “good” I guess.  If you define “good” as “it’s a sure thing that’s guaranteed to make money”, then the answer is “No.”   If you define “good” as “selling premium on a stock that is short-term overbought and entering a position that can make money as long as the stock does anything other than rally +6.3% over the next three weeks while identifying a natural resistance point to use as a stop-loss that greatly reduces the likely dollar risk on the trade”, then the answer is “Maybe.” (It also suggests that you could use slightly less long-winded definitions of simple words like “good” – but let’s not worry about that right now…..)

Jay Kaeppel