Nothing is permanent in the financial markets. Each security – both on its own and relative to other securities – moves in waves. Sometimes the tide is favorable and sometime it definitely is not. Identifying the exact moment when the tide turns is a fool’s errand. But failing to recognize a change in tide – and reacting accordingly – is equally as foolish.
Financials
The financial sector has caught my eye. Please note that the previous sentence says “The financial sector has caught my eye” and NOT “PUT EVERYTHING YOU HAVE INTO FINANCIAL STOCKS BECAUSE THEY ARE SURE TO GO UP!!!!” Note the subtle difference between the two sentences.
The primary thing that caught my attention was the research appearing in Figure 1 from www.Sentimentrader.com that displays action for the financial sector following previous “thrusts” such as we just saw recently.
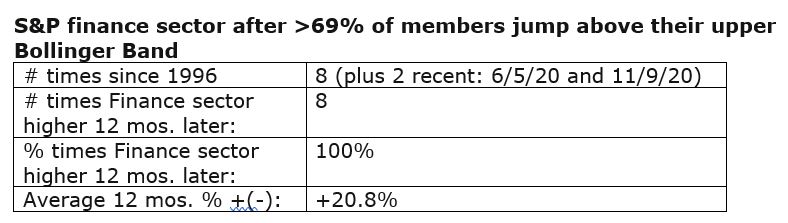
Figure 1 – Financials performance after “thrusts” (Courtesy Sentimentrader.com)
The gist of it is that following the previous 9 signals the finance sector stood higher 12 months later 100% of the time, with an average gain of +20.8%. Does this guarantee a gain 12 months from the 11/9/20 signal? Not at all. But it sure smells like a potential opportunity.
Ticker XLF – Price Action
Figure 2 displays the daily chart for ticker XLF (SPDR Financials ETF), which is a pretty choppy and – on the face of it – uninspiring affair.
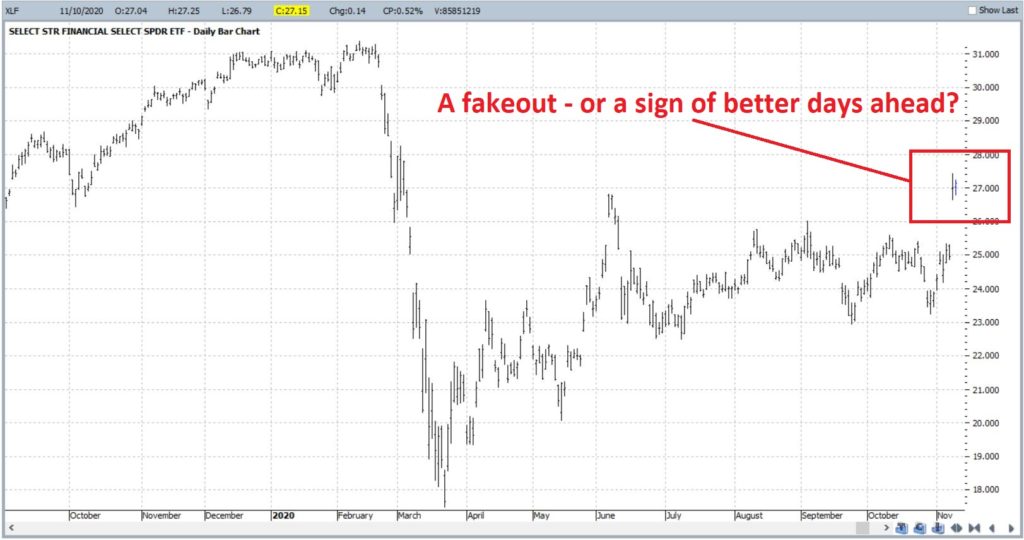
Figure 2 – XLF Daily (Courtesy ProfitSource by HUBB)
Figure 3 displays a weekly chart of XLF. My eyes are immediately drawn to the previous peaks around $31 a share. The good news is that this level serves as a good price target. The bad news is that it represents a significant area of resistance should it actually get there.
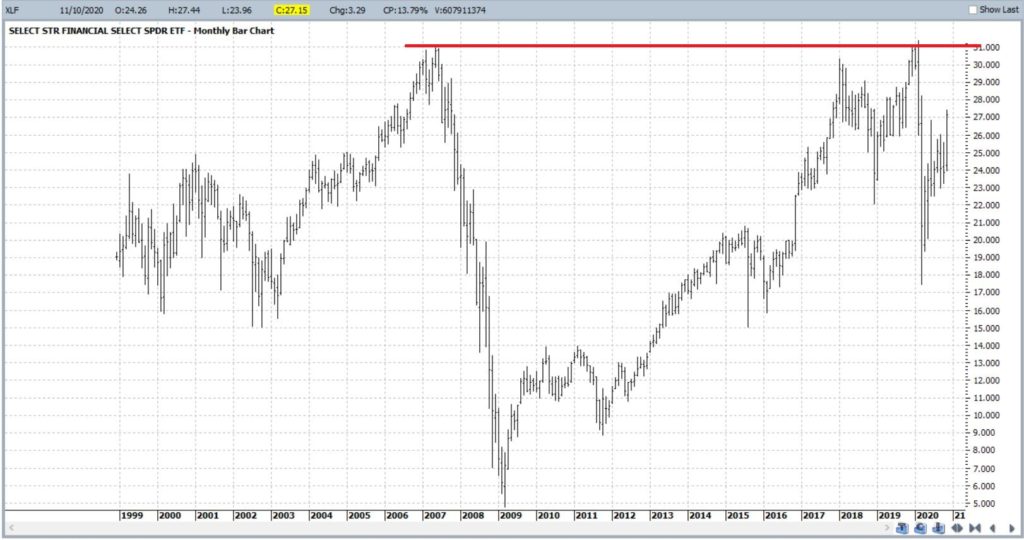
Figure 3 – XLF Weekly (Courtesy ProfitSource by HUBB)
Ticker XLF – Relative Performance
In looking for a “change of tide”, consider Figure 4. This chart displays the performance of XLF relative to the performance of the S&P 500 (when the bars in an uptrend it means financials are outperforming SPX and vice versa). As you can see, financials have significantly underperformed since early 2018. We should be watching this for an upside reversal.
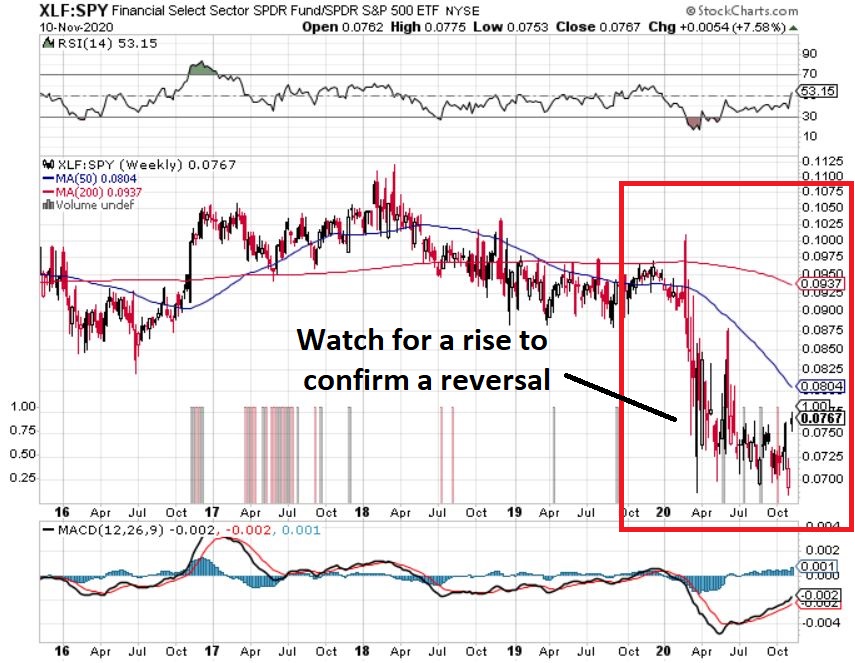
Figure 4 – XLF performance relative to SPY performance (Courtesy StockCharts.com)
Financials – Seasonality
The November 1 through April 30th period is “typically” favorable for financial stocks. As a proxy (and to obtain a longer track record) here we will use ticker FIDSX (Fidelity Select Financial Services). Figure 5 displays the cumulative growth achieved by holding FIDSX during November through April every year since inception in 1982.
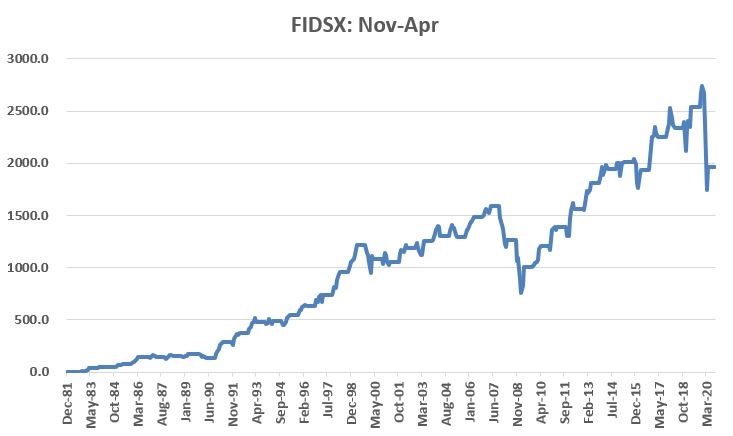
Figure 5 – FIDSX cumulative % return during Nov-Apr; 1982-2020
When things go bad, they tend to go very bad (FIDSX lost -21.7% From Nov 1, 2019 through Apr 30, 2020). Note that there were 4 periods (1990, 2008, 2009 and 2020) that showed a loss of -10% or more. On the flip side, 17 of the 29 UP years showed a gain in excess of +10%. Figure 6 displays the overall results.
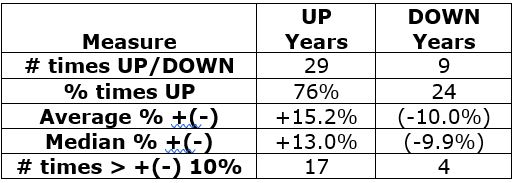
Figure 6 – FIDSX during Nov-Apr
So, is this a good time to take the plunge into financial stocks? JOTM just provides information, NOT recommendations or predictions. But to play out the example let’s consider a hypothetical example trade.
Betting on XLF
For an investor who wants to bet on an advance in XLF over the next year the most straightforward approach is simply to buy 100 shares of XLF and “hold on tight.” As I write XLF is trading at $27.15 a share, so buying 100 shares involves an investment of $2,715. One question an investor would need to ask an answer is, “am I just going to ride it out for 12 months come hell or high water, or will I set a stop-loss point?”. If the latter then the next decision is where to place a stop-loss.
As a less-costly alternative, let’s consider a “stock replacement” position using a call option in ticker XLF. Our trade involves buying the January 2022 call option with a strike price of $21. In real-world trading we would use a limit order to try to buy closer to the midpoint of the bid/ask range. But for sake of example we will buy “at the market” at $7.00 (x 100 shares = $700).
Figure 7 displays the particulars and Figure 8 the risk curves.
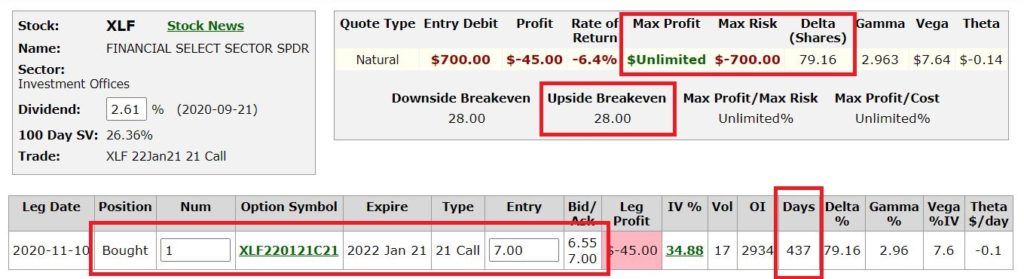
Figure 7 – XLF long call (Courtesy www.OptionsAnalysis.com)

Figure 8 – XLF long call risk curves (Courtesy www.OptionsAnalysis.com)
Things to note:
*Cost to enter and maximum risk (if XLF drops below $21 a share) is $700
*The breakeven price is $28 a share.
Above $28 a share the option will move point-for-point with the stock.
If XLF rallies to $31 a share:
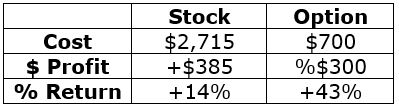
Figure 9 – Stock versus Call Option if XLF rallies to $31
Summary
Is XLF due to rally in the year ahead? It beats me. But there is some evidence to argue that way. If so and investor has a choice, a) do nothing, b) buy stock, c) buy a call option.
The choice is yours.
See also Jay Kaeppel Interview in July 2020 issue of Technical Analysis of Stocks and Commodities magazine
See also Jay’s “A Strategy You Probably Haven’t Considered” Video
See also Video – The Long-Term…Now More Important Than Ever
Jay Kaeppel
Disclaimer: The information, opinions and ideas expressed herein are for informational and educational purposes only and are based on research conducted and presented solely by the author. The information presented represents the views of the author only and does not constitute a complete description of any investment service. In addition, nothing presented herein should be construed as investment advice, as an advertisement or offering of investment advisory services, or as an offer to sell or a solicitation to buy any security. The data presented herein were obtained from various third-party sources. While the data is believed to be reliable, no representation is made as to, and no responsibility, warranty or liability is accepted for the accuracy or completeness of such information. International investments are subject to additional risks such as currency fluctuations, political instability and the potential for illiquid markets. Past performance is no guarantee of future results. There is risk of loss in all trading. Back tested performance does not represent actual performance and should not be interpreted as an indication of such performance. Also, back tested performance results have certain inherent limitations and differs from actual performance because it is achieved with the benefit of hindsight.

