In this article I wrote about the fairly amazing seasonality of ticker AMD. That version “cut things a little fine” – i.e., the buy and sell dates very specific within different months. Today – for no particular reason – I want to put out a simpler version.
Rules
Hold ticker AMD:
*During the months of November through May
*During the month of August
These are considered “favorable” months. All other months (June, July, September and October are considered “unfavorable.”
Results
Figure 1 displays the net results using daily price data from Jan 1990 through 11/9/20.
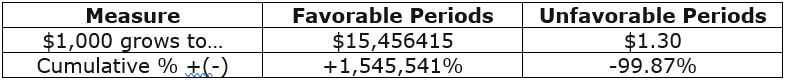
Figure 1 – AMD Results: Favorable versus Unfavorable periods
Figure 2 displays the growth of $1,000 invested in AMD ONLY during the favorable periods (note this is a “logarithmic” scale chart – i.e., the distance between $10 and $100 is the same the distance between $100 and $1,000, etc.)
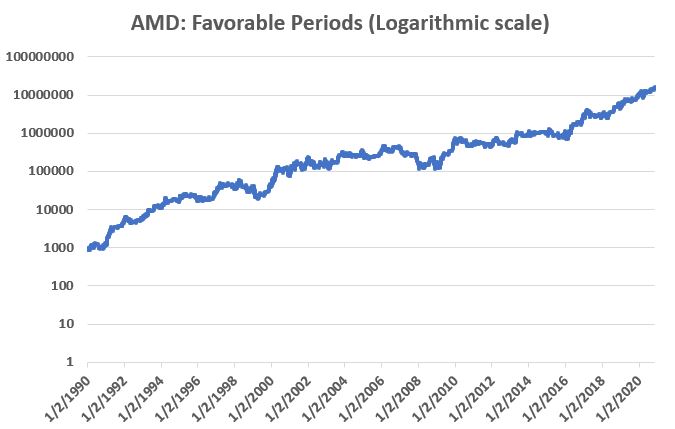
Figure 2 – Growth of $1,000 in AMD ONLY during Favorable periods
Figure 3 displays the growth of $1,000 invested in AMD ONLY during the unfavorable periods (note this also is a “logarithmic” scale chart)
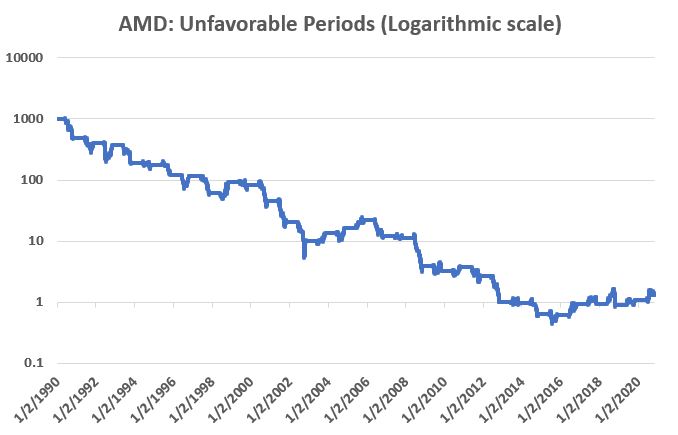
Figure 3 – Growth of $1,000 in AMD ONLY during Unfavorable periods
For measuring purposes we will end AMD’s “Fiscal Year” on August 31st and look back at performance over the prior 12 months for “Favorable” and “Unfavorable” periods. Figure 4 displays the year-by-year results.
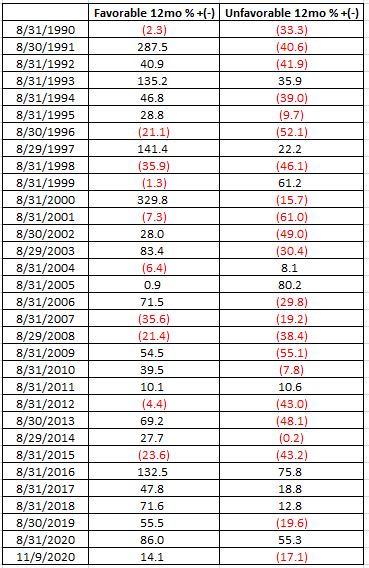
Figure 4 – AMD Seasonality Year-by-Year
Summary
One major caveat to note. Buying and holding AMD only during the Favorable periods would have involved riding out two drawdowns in excess of -60%(!!), including a -75% drawdown during the 2007-2009 bear market. So there’s that.
If one can somehow get past that – or around it somehow, perhaps with some sort of stop-loss provision – the overall results are, ahem, “compelling.”
Does this mean that AMD is guaranteed to soar between now and June 2021 (up +10% so far)? Not at all. Is this really a viable “investment strategy?” That’s not for me to say.
Still, let’s just say – there appears to be “something there” that might be worth a closer look and a little independent research.
See also Jay Kaeppel Interview in July 2020 issue of Technical Analysis of Stocks and Commodities magazine
See also Jay’s “A Strategy You Probably Haven’t Considered” Video
See also Video – The Long-Term…Now More Important Than Ever
Jay Kaeppel
Disclaimer: The information, opinions and ideas expressed herein are for informational and educational purposes only and are based on research conducted and presented solely by the author. The information presented represents the views of the author only and does not constitute a complete description of any investment service. In addition, nothing presented herein should be construed as investment advice, as an advertisement or offering of investment advisory services, or as an offer to sell or a solicitation to buy any security. The data presented herein were obtained from various third-party sources. While the data is believed to be reliable, no representation is made as to, and no responsibility, warranty or liability is accepted for the accuracy or completeness of such information. International investments are subject to additional risks such as currency fluctuations, political instability and the potential for illiquid markets. Past performance is no guarantee of future results. There is risk of loss in all trading. Back tested performance does not represent actual performance and should not be interpreted as an indication of such performance. Also, back tested performance results have certain inherent limitations and differs from actual performance because it is achieved with the benefit of hindsight.


I’m wondering if you’ve run the numbers on SMPIX vs. AMD. The former doesn’t go back as far as June of 2000 but that’s 20 years and includes the dot com and 2008 meltdowns. It would be good to see.