There are few sectors more volatile – and more unpredictable – than gold miners. Let’s face it, the business of digging gold out of mines is a tough one and is almost entirely dependent upon the price of gold. From the high is 2011 to the low in 2016 ticker GDX lost roughly 88% of its value. On the flip side it is presently about 200% above that 2016 low. So, if you are looking for “action”, you’ve come to the right place.
Looking for Clues
Figure 1 displays a study from www.Sentimentrader.com. It essentially highlights performance after a pullback in an uptrend. While it sounds like a bearish setup (a certain percentage of stocks in the sector breaking down) it also highlights why it is important to study actual data and NOT rely on instinct and hunches.
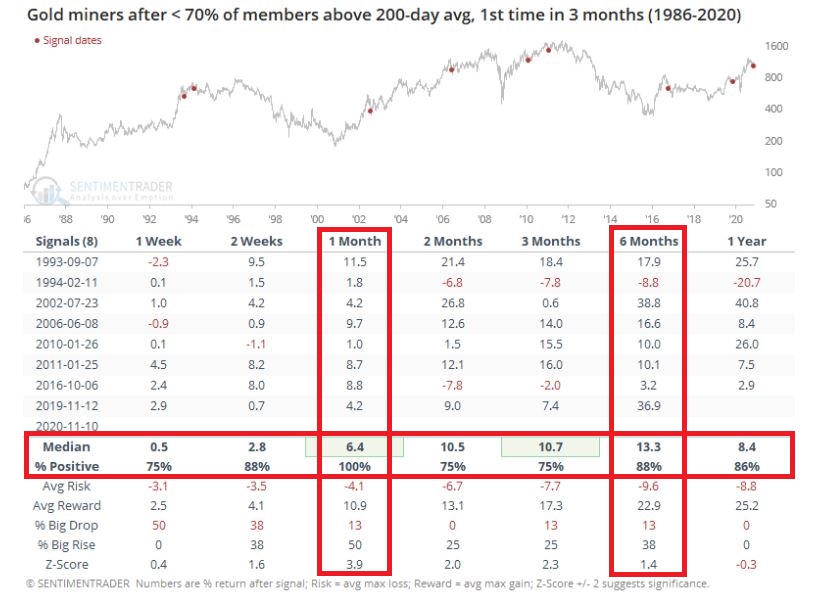
Figure 1 – Gold Miners potentially favorable sign (Courtesy Sentimentrader.com)
The gist of Figure 1 is that the current setup has typically – though important, not always – followed by bullish price action for gold miners across virtually every timeframe in the next year – most notably 1 month and 6 months.
Let’s add a little more “fuel to the fire.”
Figure 2 highlights the fact that trader sentiment on GDX has been very low. This often serves as a favorable contrarian (i.e., bullish) signal.
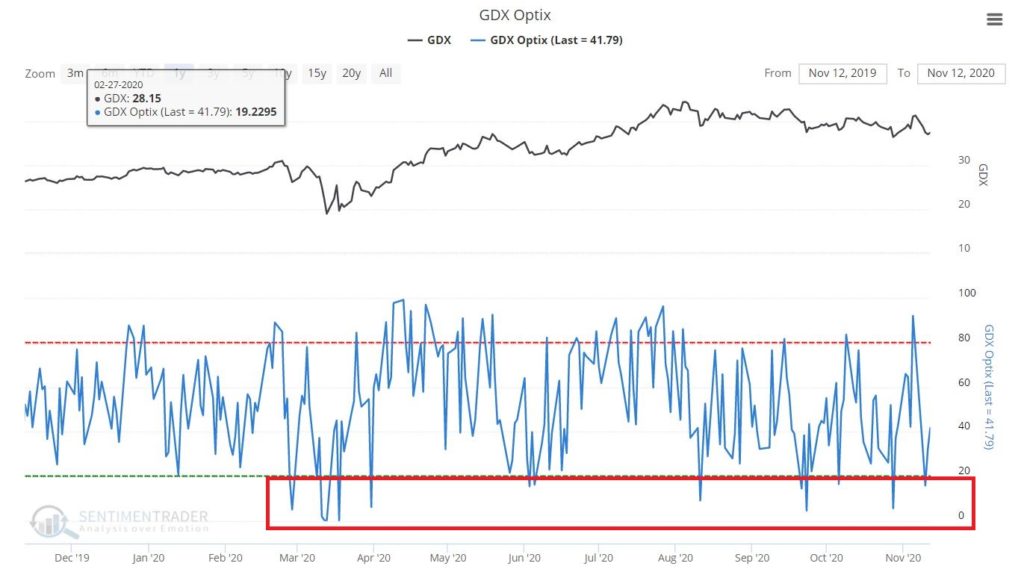
Figure 2 – GDX trader sentiment (Courtesy Sentimentrader.com)
Figure 3 highlights the fact that November through February tends to be “seasonally favorable” for gold mining stocks (it should be noted that this highlights a long-term tendency and that results from year-to-year can be extremely volatile).
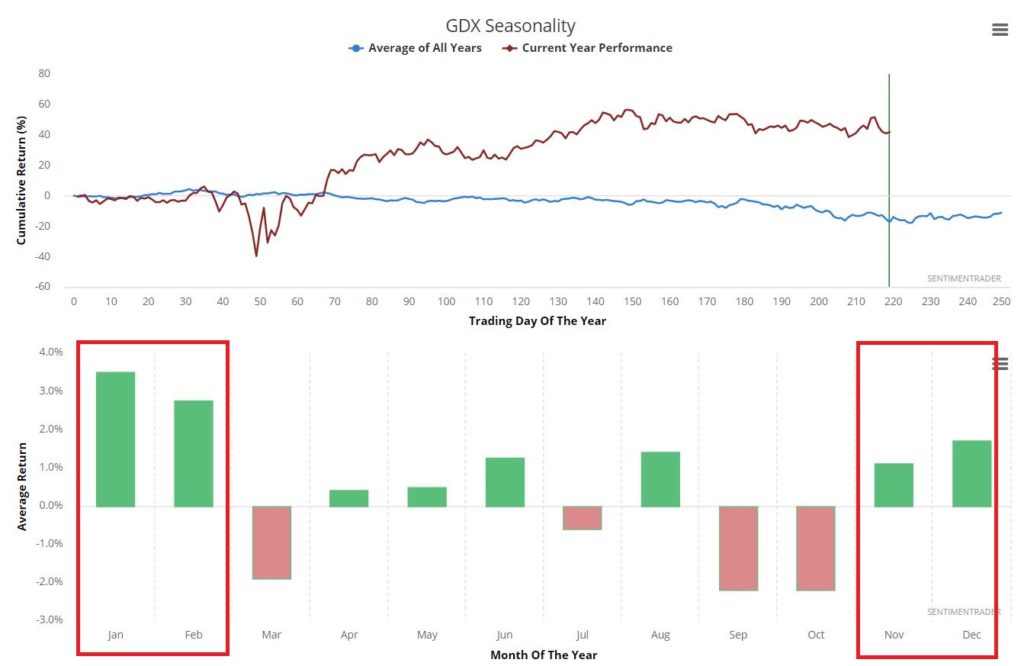
Figure 3 – GDX seasonality (Courtesy Sentimentrader.com)
So, when we add it all up, the information so far seems to signal a potentially bullish setup for gold miners. Will this in fact be how it plays out? It beats me. The key questions here are:
*Will you consider a bullish trade or stand aside?
*Which trade to make?
*And most importantly – what are the risks of that trade and can I handle that level of risk?
A 1-Month Trade
The most straightforward approach would be to buy 700 shares of GDX and sell 100 shares at 1 week, 2 weeks, 1 month, 2 months, 3 months, 6 months and 1 year.
To buy 700 shares of GDX as I write would cost $26,313. A trader would also need to establish some sort of stop-loss level, based on a break of a given support level and/or as a percentage of capital.
What follows is a cheaper alternative to playing for 1-month. The trade highlighted IS NOT a “recommendation” but rather an example of one way to play GDX if one is willing to accept the premise that it will be higher (or at least, not likely lower) one month from now.
The trade involves:
*Selling 1 December 36.5 put @ $1.20
*Buying 1 December 34.5 put @ $0.60
Figure 4 displays the particulars and Figure 5 displays the risk curves.
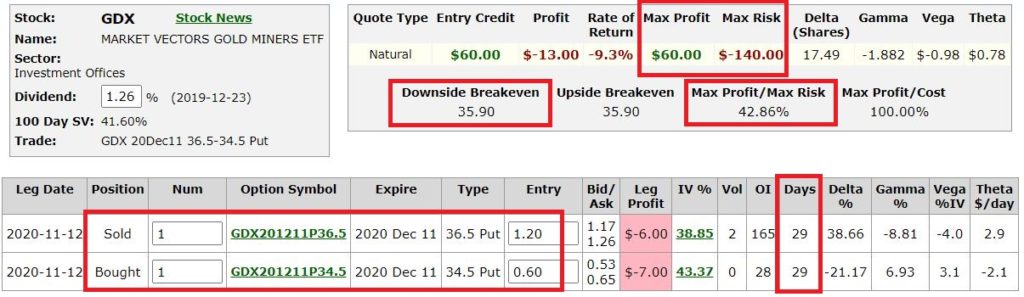
Figure 4 – GDX bull put spread details (Courtesy www.OptionsAnalysis.com)
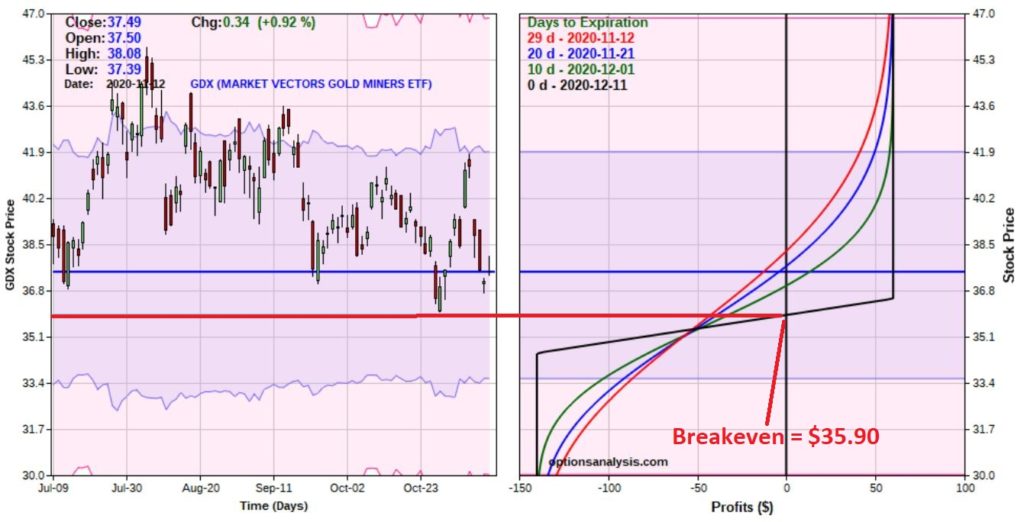
Figure 5 – GDX bull put spread risk curves (Courtesy www.OptionsAnalysis.com)
Key things to note:
*This trade costs $140 to enter a 1-lot, which is also the maximum risk
*The maximum profit is $60
*The breakeven price is $35.90 (current GDX price is $37.49)
*If GDX is trading at $36.50 a share or higher on December 11 this trade will earn 43% ($60/$140)
As long as GDX does what it is “supposed” to do (i.e., not go down) things are swell and things are great. The real question that a trader needs to ask and answer before entering a trade such as this is “what will I do if GDX goes down instead?”
Choices include:
*Ride it out and risk the full $140
*Establish a $ amount stop-loss
*Establish a GDX share price at which you will cut a loss
The recent low of $36.01 serves as an obvious candidate as a “line in the sand”, however, it is also a fairly “tight” stop-loss level.
What’s the proper play? That’s not for me to say. But note the following:
Jay’s Trading Maxim #112: Anyone can “enter” a trade. Successful traders learn how to “manage” a trade.
A subtle – but supremely important – distinction.
See also Jay Kaeppel Interview in July 2020 issue of Technical Analysis of Stocks and Commodities magazine
See also Jay’s “A Strategy You Probably Haven’t Considered” Video
See also Video – The Long-Term…Now More Important Than Ever
Jay Kaeppel
Disclaimer: The information, opinions and ideas expressed herein are for informational and educational purposes only and are based on research conducted and presented solely by the author. The information presented represents the views of the author only and does not constitute a complete description of any investment service. In addition, nothing presented herein should be construed as investment advice, as an advertisement or offering of investment advisory services, or as an offer to sell or a solicitation to buy any security. The data presented herein were obtained from various third-party sources. While the data is believed to be reliable, no representation is made as to, and no responsibility, warranty or liability is accepted for the accuracy or completeness of such information. International investments are subject to additional risks such as currency fluctuations, political instability and the potential for illiquid markets. Past performance is no guarantee of future results. There is risk of loss in all trading. Back tested performance does not represent actual performance and should not be interpreted as an indication of such performance. Also, back tested performance results have certain inherent limitations and differs from actual performance because it is achieved with the benefit of hindsight.

