The stock market sure is wickedly perverse at times. According to the historical calendar, October 28th is “the best day of the year” for the stock market. Then along comes – what else – 2020. And the market tanks on 10/28 with the Dow losing almost 950 points.
Let’s face it, the best day of 2020 is going to be December 31st.
In any event, it is pretty simple to glance at a chart of the Dow or S&P 500 and assume that the market is doomed to head lower. And maybe it is.
But then again, maybe it’s not.
The Short-Term
Figure 1 display the cumulative % growth achieved by holding the S&P 500 Index ONLY during the following 4 days each year since 1933:
*Last 2 trading days of October
*First 2 trading days of November
We will refer to this as “Power Period 1:
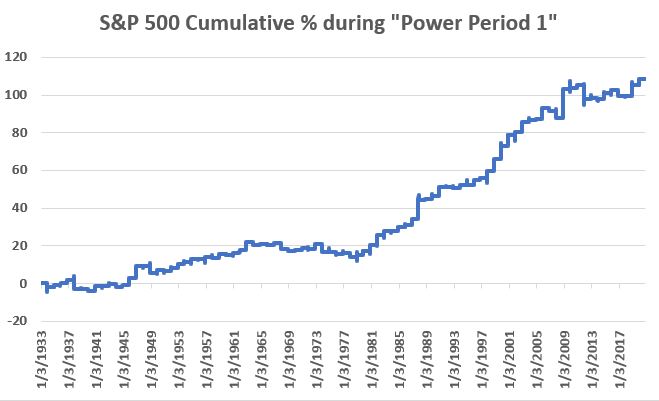
Figure 1 – S&P 500 cumulative % +(-) ONLY during 4-day Power Period 1
For the record:
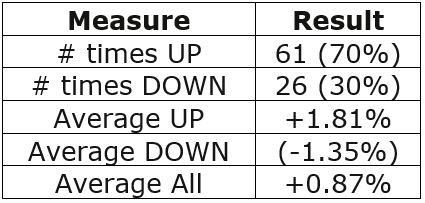
Figure 2 – Power Period 1 Results; 1933-2019
For what it’s worth, Figure 3 displays the growth during this 4-day period ONLY during Election Years.
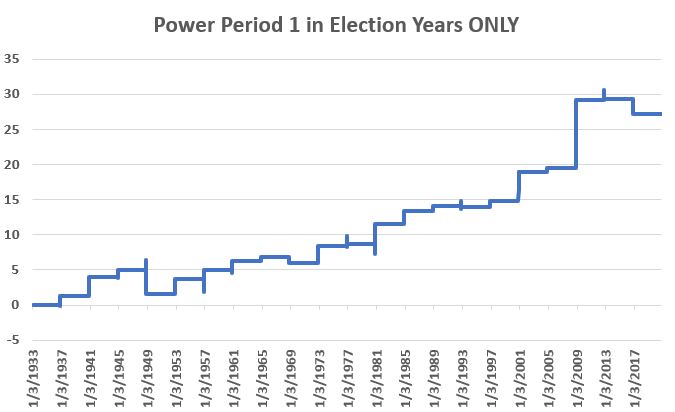
Figure 3 – S&P 500 cumulative % +(-) ONLY during 4-day Power Period 1 in Election years
1948 saw a -3.2% decline and 2016 -1.6%. On the whole however, the market showed a gain 16 out of 20 times (75%) with an average gain of +1.18%.
Summary
Does any of this mean the market is sure to bounce over the course of the next four days? Not at all. The market could easily continue on it’s current downward trajectory. Still, given all of the sudden gloom and doom, it offers your inner contrarian some serious food for thought.
See also Jay Kaeppel Interview in July 2020 issue of Technical Analysis of Stocks and Commodities magazine
See also Jay’s “A Strategy You Probably Haven’t Considered” Video
See also Video – The Long-Term…Now More Important Than Ever
Jay Kaeppel
Disclaimer: The information, opinions and ideas expressed herein are for informational and educational purposes only and are based on research conducted and presented solely by the author. The information presented represents the views of the author only and does not constitute a complete description of any investment service. In addition, nothing presented herein should be construed as investment advice, as an advertisement or offering of investment advisory services, or as an offer to sell or a solicitation to buy any security. The data presented herein were obtained from various third-party sources. While the data is believed to be reliable, no representation is made as to, and no responsibility, warranty or liability is accepted for the accuracy or completeness of such information. International investments are subject to additional risks such as currency fluctuations, political instability and the potential for illiquid markets. Past performance is no guarantee of future results. There is risk of loss in all trading. Back tested performance does not represent actual performance and should not be interpreted as an indication of such performance. Also, back tested performance results have certain inherent limitations and differs from actual performance because it is achieved with the benefit of hindsight.

