Since 1949 the stock market has showed a strong tendency to rally towards the end of the calendar year. The period we are talking about specifically is:
*The last 2 trading days of October
*Through the 3rd trading day of the following January
The Results
Figure 1 displays the cumulative % price performance for the S&P 500 Index held ONLY during the period listed above, every year starting in October 1949.
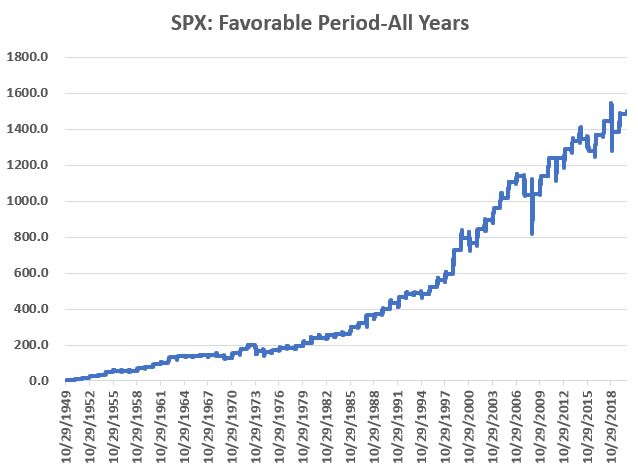
Figure 1 – S&P 500 cumulative % +(-) ONLY during seasonally favorable period; 1949-2020
For the record:
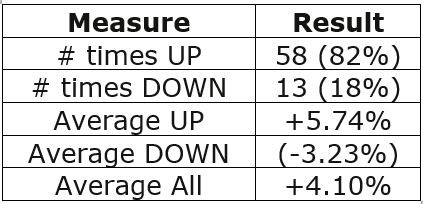
Figure 2 – S&P 500 Results – Seasonally Favorable Period; 1949-2020
For what it’s worth, Figure 3 displays the growth during the seasonally favorable period ONLY during Election Years (and NOT including the 3 days of January during the post-election year. The bear market years of 2000 and 2008 are pretty obvious.
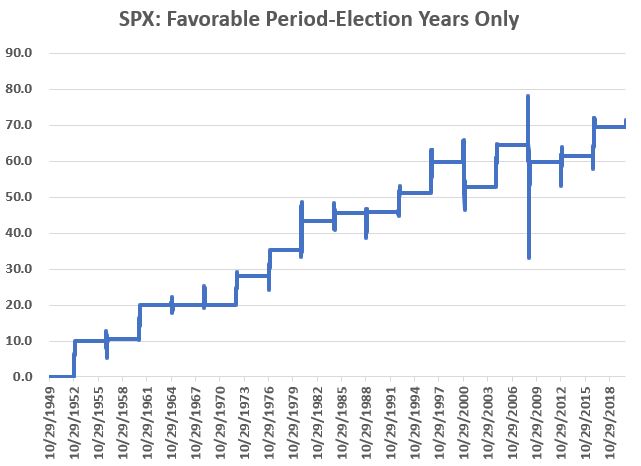
Figure 3 – S&P 500 cumulative % +(-) ONLY during Seasonally Favorable Period in Election years
During Election Years ONLY, an upward bias still exists (up 73% of the time), but not as strongly as during all years:
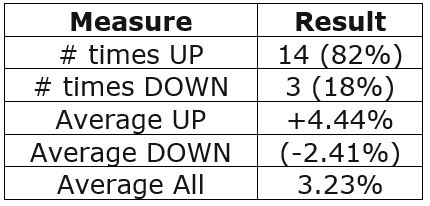
Figure 4 – Election Year ONLY results
Summary
So, should we sit back, relax and enjoy the ride, safe and secure in the knowledge that “long-term market bias” will take care of us?
Don’t you know what year this is!? 2020 has been one like no other.
The best advice might be this: As long as the major indexes hold above their long-term moving averages, the results shown here suggest giving the bullish case the benefit of the doubt. If price trends fail to confirm an uptrend and you determine that defensive steps are necessary, then defensive steps should be taken.
But given all the angst out there these days, DO NOT give into fear based on “what could happen.” Let the market itself be your guide.
See also Jay Kaeppel Interview in July 2020 issue of Technical Analysis of Stocks and Commodities magazine
See also Jay’s “A Strategy You Probably Haven’t Considered” Video
See also Video – The Long-Term…Now More Important Than Ever
Jay Kaeppel
Disclaimer: The information, opinions and ideas expressed herein are for informational and educational purposes only and are based on research conducted and presented solely by the author. The information presented represents the views of the author only and does not constitute a complete description of any investment service. In addition, nothing presented herein should be construed as investment advice, as an advertisement or offering of investment advisory services, or as an offer to sell or a solicitation to buy any security. The data presented herein were obtained from various third-party sources. While the data is believed to be reliable, no representation is made as to, and no responsibility, warranty or liability is accepted for the accuracy or completeness of such information. International investments are subject to additional risks such as currency fluctuations, political instability and the potential for illiquid markets. Past performance is no guarantee of future results. There is risk of loss in all trading. Back tested performance does not represent actual performance and should not be interpreted as an indication of such performance. Also, back tested performance results have certain inherent limitations and differs from actual performance because it is achieved with the benefit of hindsight.


Hmm… “last 2 trading days of October…” which may be a powerful strategy, Jay, but I got this on the last day of October! So I’m thinking the better strategy is your “Calendar + Trend” (5-19-20) in which case starting this Monday (11-2-20) I add 2 pts, and with the $SPX being above the 200 MA I add 1 pt for a total of 3 pts which points me on a stress-free up trend ride through May. Onward! I mean it just gets better…
Stay safe,
Jim