Buying and holding an S&P 500 Index fund is not my favorite approach to investing. While it is an approach to investing that likely millions of investors follow to one degree or another, I refer to it as a “drifting with the tide” strategy. As long as the sky is blue and the waters are calm, things are swell and things are great. But when the inevitable storm rolls in and the wind picks up and the waves start to crash it becomes an entirely different experience.
Sometimes our mind just needs a break from all of the volatility, turmoil and uncertainty that surrounds the stock market.
But “when” to take those breaks is a question that has confounded market participants since the first time some trader somewhere shouted “Buy” whilst another yelled “Sell”.
The unvarnished truth is that there are no “perfect” methods. But there are things that can “serve a purpose”. Let’s consider one of those today.
The Indicators
We will use 4 data series, using quarterly total return data for each:
A = 3-month t-bills
B = Bloomberg Barclays Aggregate Bond Index
C = Bloomberg Barclays Intermediate Treasury Index
D = S&P 500 Index
E = B – A (i.e., Aggregate bond index minus t-bill quarterly return)
The Trading Rules
At the end of each quarter:
*If E > 0 then hold S&P 500 Index for the next quarter
*If E < 0 then hold Bloomberg Barclays Intermediate Treasury Index
In English:
*If the Aggregate Bond index outperformed t-bills in the most recent quarter we will hold stocks the following quarter.
*If the Aggregate Bond index underperformed t-bills is the most recent quarter we will avoid stocks and linger in the relative safety of intermediate-term treasuries in the following quarter.
The Results
All results use quarterly total return data starting at the end of 1st quarter of 1976. To make things easier:
*If Aggregate Bond Index outperforms t-bills the next quarter is referred to as a “Favorable” quarter
*If Aggregate Bond Index underperforms t-bills the next quarter is referred to as an “Unfavorable” quarter
Figure 1 displays the cumulative return for the S&P 500 (SPX) and intermediate treasuries (Int. Treas.) if held ONLY during Favorable quarters.
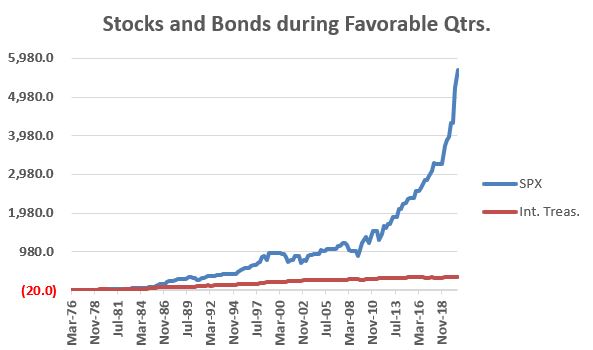
Figure 1 – Stock and bond performance during Favorable Quarters
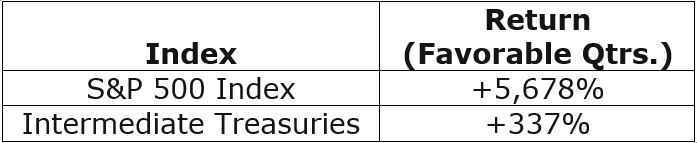
Figure 2 – Stock and Bond performance during Favorable Quarters
Clearly stocks outperform by an order of significant magnitude during “Favorable” quarters.
Figure 3 displays the cumulative return for the S&P 500 (SPX) and intermediate treasuries (Int. Treas.) if held ONLY during Unfavorable quarters.
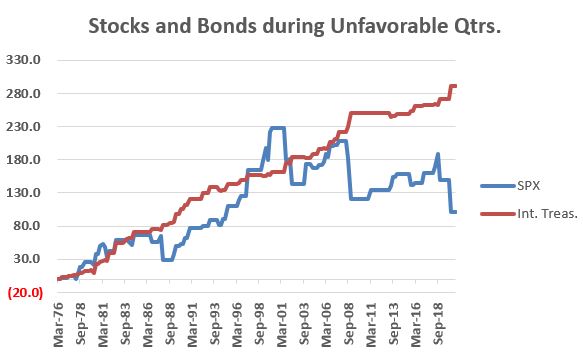
Figure 3 – Stock and bond performance during Unfavorable Quarters
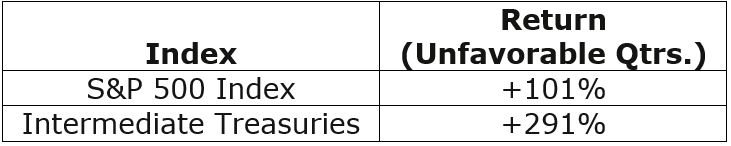
Figure 4 – Stock and bond performance during Unfavorable Quarters
During “Unfavorable” quarters stocks are a roller-coaster ride – often up, but also occasionally crashing lower – while bonds appear to offer steady, low volatility returns.
The bottom line:
*Stocks have vastly outperformed during Favorable quarters
*Bonds have returned almost 3 times as much as stocks (with vastly lower volatility) during Unfavorable quarters
Jay’s Risk On/Risk Off Strategy
So, let’s put the pieces of the puzzle together:
*During Favorable quarters we will hold SPX
*During Unfavorable quarters we will hold Intermediate Treasuries
Figure 5 displays the cumulative growth of our “Risk On/Risk Off Strategy” (these are hypothetical results using index data)
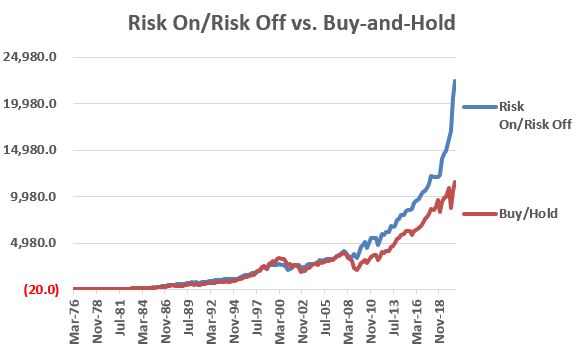
Figure 5 – Cumulative return for Jay’s Risk On/Risk Off Strategy versus buying and holding S&P 500 Index (3/31/76-9/30/20)
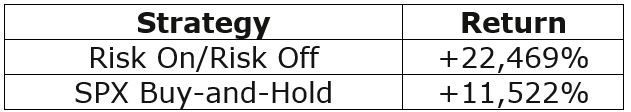
Figure 6 – Cumulative return for Jay’s Risk On/Risk Off Strategy versus buying and holding S&P 500 Index (3/31/76-9/30/20)
Real-World Application
Here is how I follow this indicator in real-time. Make the measurement after the close on the 3rd to last trading day of each quarter (ex., if the last day of a quarter is Friday the 30th, then we measure at the close on Wednesday the 28th. Any trading action will take place at the close on the 30th).
As of the close on the 3rd to last trading day of each quarter:
A = Total return data for ticker BIL as of today
B = Total return data for ticker BIL 63 trading days ago
C = Total return data for ticker VBMFX as of today
D = Total return data for ticker VBMFX 63 trading days ago
E = (A / B) – 1) *100
F = (C / D) – 1) *100
E is the 3-month change for t-bills
F is the 3-month change for the total bond market
The Rules:
*If F >= E (on the 3rd to last trading day of the quarter), then Risk On for the next 3 months
*If F < E (on the 3rd to last trading day of the quarter), then Risk Off for the next 3 months
Ticker BIL: SPDR Bloomberg Barclays 1-3 Month T-Bill ETF
Ticker VBMFX: Vanguard Total Bond Market Index Fund Investor Shares
Ticker SPY: SPDR S&P 500 ETF Trust
Ticker IEI: iShares 3-7 Year Treasury Bond ETF
This approach was Risk Off during Q1 of 2020 and has been Risk On since.
Summary
The purpose here is not to suggest an “All In” or “All Out” approach to investing. When the Risk On/Risk Off indicator suggests “Risk Off”, the implication:
*IS NOT that investors should “SELL EVERYTHING” and run for the hills
*IS simply that investors may benefit from “playing some defense” during the ensuing quarter
Nothing more, nothing less.
See also Jay Kaeppel Interview in July 2020 issue of Technical Analysis of Stocks and Commodities magazine
See also Jay’s “A Strategy You Probably Haven’t Considered” Video
See also Video – The Long-Term…Now More Important Than Ever
Jay Kaeppel
Disclaimer: The information, opinions and ideas expressed herein are for informational and educational purposes only and are based on research conducted and presented solely by the author. The information presented represents the views of the author only and does not constitute a complete description of any investment service. In addition, nothing presented herein should be construed as investment advice, as an advertisement or offering of investment advisory services, or as an offer to sell or a solicitation to buy any security. The data presented herein were obtained from various third-party sources. While the data is believed to be reliable, no representation is made as to, and no responsibility, warranty or liability is accepted for the accuracy or completeness of such information. International investments are subject to additional risks such as currency fluctuations, political instability and the potential for illiquid markets. Past performance is no guarantee of future results. There is risk of loss in all trading. Back tested performance does not represent actual performance and should not be interpreted as an indication of such performance. Also, back tested performance results have certain inherent limitations and differs from actual performance because it is achieved with the benefit of hindsight.

