Despite all of the “pumping” by the Fed, the 30-year treasury bond is roughly 11% off of its high from back in March. The primary models that I use to track the major trend of the bond market are still bearish. So, I have no reason to – and am not – pounding the table about getting bullish on bonds.
That being said, the shorter-term “trader” in me is sensing the potential for a “bounce” in bonds (Important Note: the short-term trader in me is also wrong a lot. So, what follows is NOT a recommendation but an example of one way to play a trading “hunch” but with a relatively low dollar risk).
The Background
Figure 1 from www.Sentimentrader.com displays 30-year bond price action in the top clip and trader sentiment (or Optix) in the bottom clip. Note that sentiment just bounced off of 0%. Previous occurrences are noted by the red dots.
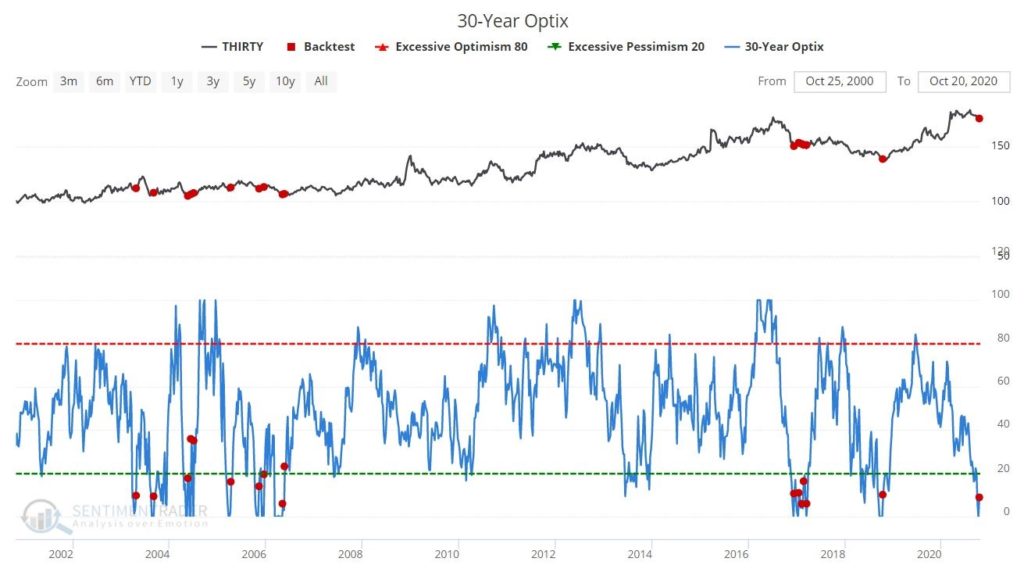
Figure 1 – 30-yr. treasury bonds and trader sentiment (Courtesy Sentimentrader.com)
Figure 2 displays the action of 30-yr. bonds following previous bounces in sentiment from below 5% to above 5%. Note that bonds typically witnessed an advance in the next 1 to 6 months.
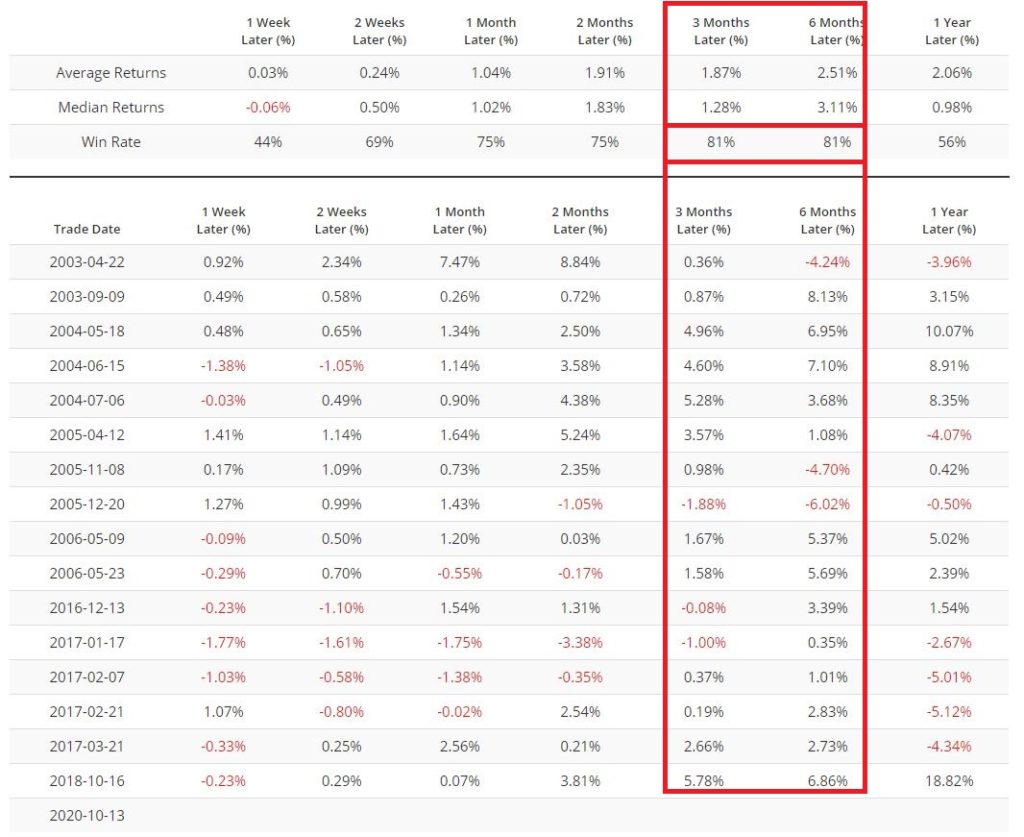
Figure 2 – Bond price action following previous “bounces” in sentiment (Courtesy Sentimentrader.com)
In Figure 3 from ProfitSource by HUBB we see that the weekly Elliott Wave chart is suggesting the potential for an advance in the months ahead. For the record, my confidence level with a single weekly EW count in and of itself is moderate at best. However, when sentiment and price action appear to align, I start to pay closer attention. Note that the EW projection is suggesting a potential rally in the next 1 to 6 months – pretty much in line with the sentiment history above.
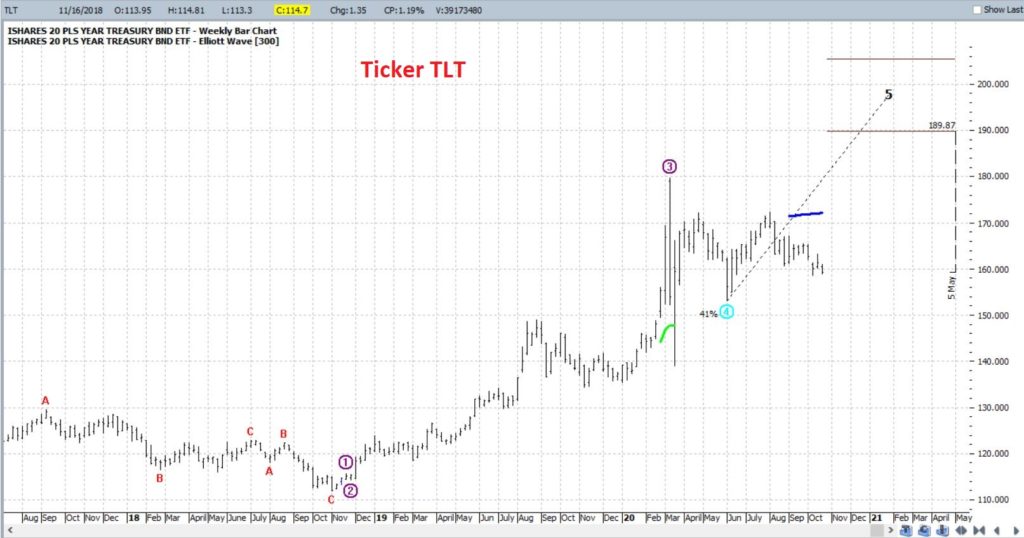
Figure 3 – Ticker TLT with bullish weekly Elliott Wave count (Courtesy ProfitSource by HUBB)
One Way to Play
In reality there are lots of ways to play. The most straightforward would be to buy a 30-year treasury bond futures contract or to buy 100 shares of the ETF ticker TLT which track the long-term treasury. Both of these positions have inherent risks. T-bond futures trade at $1,000 a point. So, if bonds go south instead of north a fairly large dollar risk can be realized very quickly. Likewise, buying 100 shares of ticker TLT will cost roughly $15,900. So again, not a small commitment.
REMEMBER: What we are attempting to accomplish here is simply to provide an example of one way to play an entirely speculative situation (i.e., betting on a short-term “bounce” in bonds) without having to worry about the potential to lose a lot of money if things go the wrong way.
So, let’s consider a position using options on ticker TLT. The first thing I like to determine is if the options on a given security are “cheap”, “expensive” or somewhere in between, in order to choose the proper strategy. In Figure 4 we see that the implied volatility for options on ticker TLT are not high or low, but rather “somewhere in between.” (High implied volatility means there is a lot of time premium built into the options – i.e., “expensive”, and vice versa).
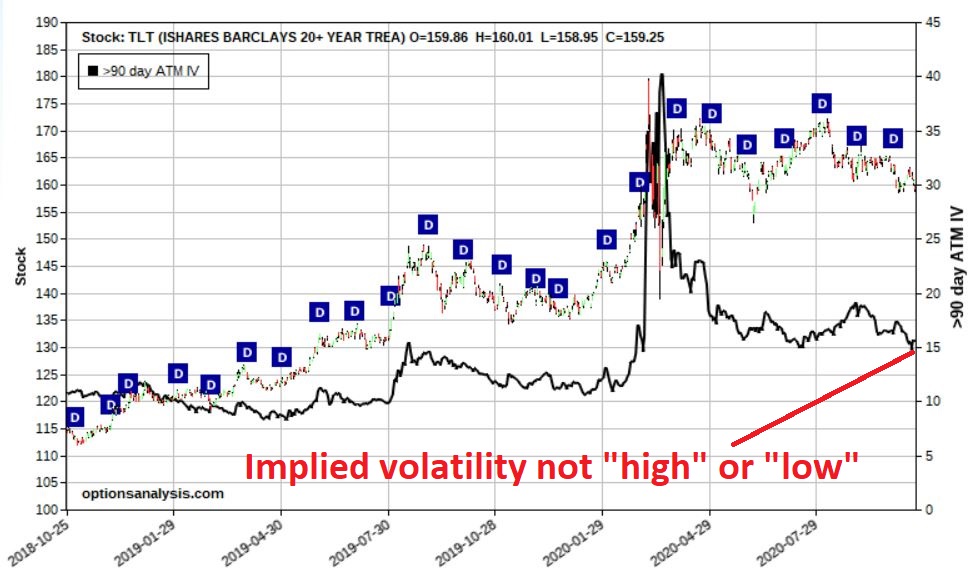
Figure 4 – Implied volatility for options on ticker TLT (Courtesy www.OptionsAnalysis.com)
The strategy we will consider is called the “out-of-the-money butterfly spread”, or “OTM call fly” as we hip, happening option trader geeks like to call them.
This trade involves:
*Buying 1 Jan2021 160 call @ $4.25
*Selling 2 Jan2021 190 calls @ $0.21
*Buying 1 Jan2021 220 call @ $0.13
NOTE: This example assumes that a “market order” is used and that the order is filled by buying at the ask price for the 160 and 220 calls and selling at the bid price for the 190 call. In reality, us hip, happening option trading geeks would likely put in a limit order attempting to enter closer to the midpoint of the bid/ask spread for each option.
Figure 5 displays the particulars and Figure 6 displays the risk curves.
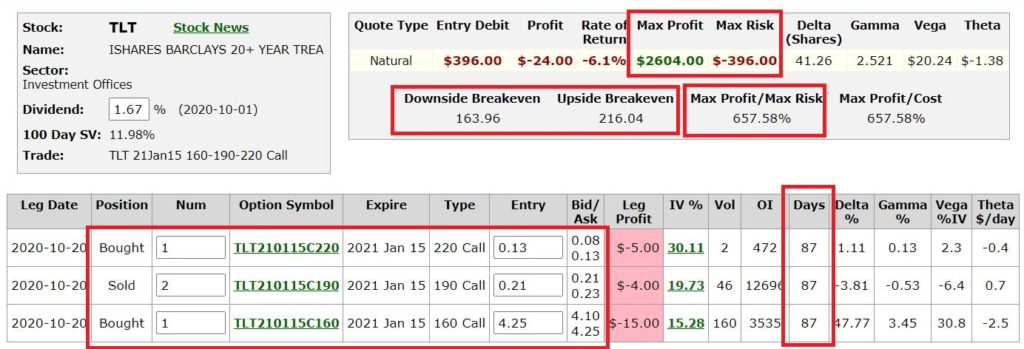
Figure 5 – TLT OTM Call Fly particulars (Courtesy www.OptionsAnalysis.com)
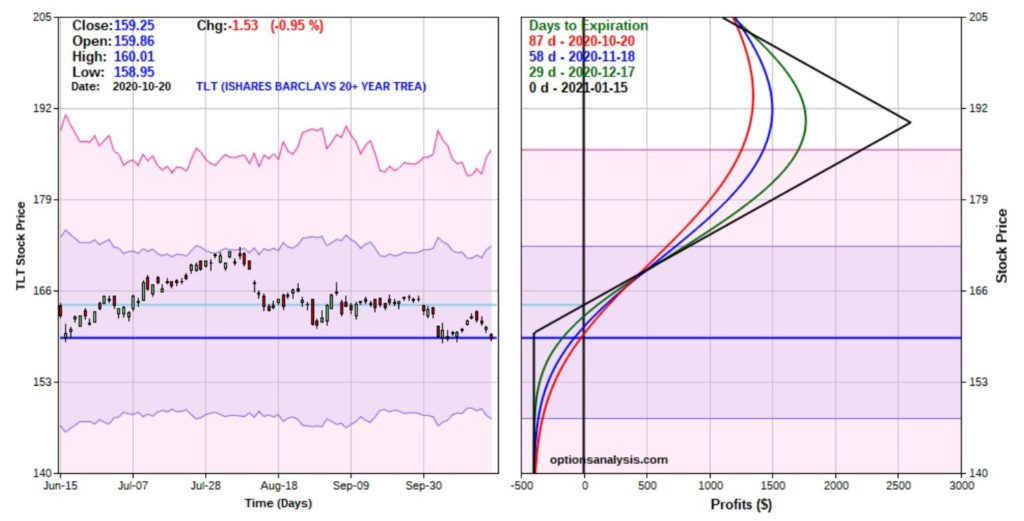
Figure 6 – TLT OTM Call Fly risk curves (Courtesy www.OptionsAnalysis.com)
Remember, our goal is to make a decent return if bonds do in fact rally in the months directly ahead while NOT risking a lot of money.
*As you can see in Figure 6, profits can accumulate pretty nicely if the price of TLT does in fact rise towards the target shown in Figure 3.
*At the same time, the worst-case scenario is a loss of -$396 on a 1x2x1 spread if it all falls apart.
Two thoughts from a position management point-of-view:
*On the downside a trader might either, a) resolve to hold through expiration and risk the full $396 hoping for a bounce somewhere along the way, or, b) determine a stop-loss point at which point they would “throw in the towel” and salvage whatever they can by exiting the trade early.
*On the upside, note that the risk curves do “roll over” when price approaches $190 a share. In other words, above this price your profit would actually start to get smaller again. So, if the “best case” scenario did in fact unfold and TLT rallied towards the EW target of $189+ a trader MUST be prepared to take some sort of action, i.e., either a) take a profit, or, b) adjust the position.
Summary
Please remember that the proper subtitle for this article is NOT “Pundit predicts massive rally in bonds”. The proper subtitle is more along the lines of “Silly cheapskate speculator gets a hankering to pick a bottom in a downtrend and doesn’t want to lose his shirt.”
The former is more succinct, but the latter is more accurate.
See also Jay Kaeppel Interview in July 2020 issue of Technical Analysis of Stocks and Commodities magazine
See also Jay’s “A Strategy You Probably Haven’t Considered” Video
See also Video – The Long-Term…Now More Important Than Ever
Jay Kaeppel
Disclaimer: The information, opinions and ideas expressed herein are for informational and educational purposes only and are based on research conducted and presented solely by the author. The information presented represents the views of the author only and does not constitute a complete description of any investment service. In addition, nothing presented herein should be construed as investment advice, as an advertisement or offering of investment advisory services, or as an offer to sell or a solicitation to buy any security. The data presented herein were obtained from various third-party sources. While the data is believed to be reliable, no representation is made as to, and no responsibility, warranty or liability is accepted for the accuracy or completeness of such information. International investments are subject to additional risks such as currency fluctuations, political instability and the potential for illiquid markets. Past performance is no guarantee of future results. There is risk of loss in all trading. Back tested performance does not represent actual performance and should not be interpreted as an indication of such performance. Also, back tested performance results have certain inherent limitations and differs from actual performance because it is achieved with the benefit of hindsight.

