The U.S. stock market has mostly vastly outperformed the rest of the world’s stock markets in recent years. The longer this trend persists the more investors get “used to” and “comfortable” (i.e., complacent) with this trend as a way of life. But if there is one thing we know for sure when it comes to the markets is that “no trend lasts forever.”
One day, the relationship will turn, and U.S. stock indexes will lag international stock indexes. I firmly expect this change to take place and play out sometime over the next 5 to 10 years. That being said, there is no evidence that this change is in the works at the moment. So, what follows IS NOT a “call to action.” I refer to it as a “call to pay attention.”
SPX vs. EAFE
As our measure we will use the S&P 500 Index as our measure of U.S. stock performance and the MSCI EAFE Index as our measure of international stock performance (using monthly total return data for each index).
Our test data begins on 12/31/1974.
Figure 1 displays the growth of $1,000 invested in each index on a buy-and-hold basis since that time.
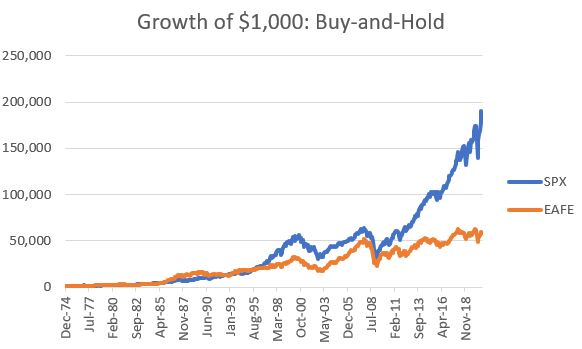
Figure 1 – Growth of $1,000 in SPX and EAFE since 12/31/1974
The knee jerk reaction more many investors will be to say “it looks like SPX is the better investment because it made more money.” However, Figure 2 displays the ratio between the two equity curves in Figure 1. Note that there is a definite “back and forth” between the two. When the line in Figure 2 is rising it means that SPX is outperforming and when the line in Figure 2 is declining it means that the EAFE is outperforming.
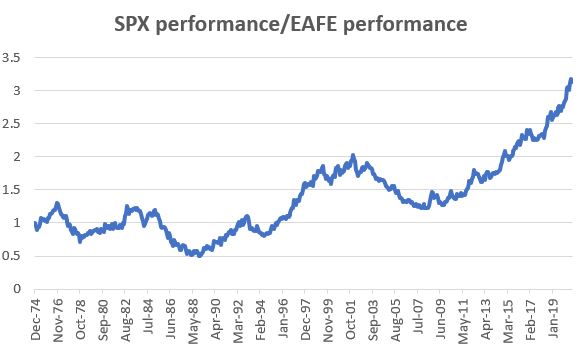
Figure 2 – SPX growth vs. EAFE growth (1974-2020)
Figure 3 displays the same line as Figure 2 but adds an 11-month exponential moving average.
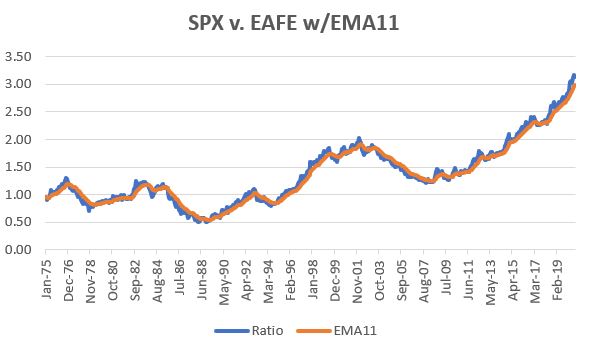
Figure 3 – SPX vs. EAFE plus 11-month EMA
So far, we have:
A = $1,000 invested in SPX (cumulative growth)
B = $1,000 invested in EAFE (cumulative growth)
C = A/B
D = 11-month EMA
E = C – D
Figure 4 displays the difference between the 2 lines displayed in Figure 3, i.e., Value E above.
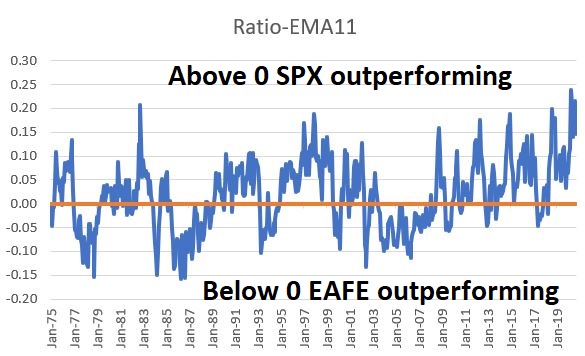
Figure 4 – SPX/EAFE Ratio minus 11-month EMA
Figure 5 displays the growth of equity for each index if held ONLY when SPX is outperforming (i.e., when the line in Figure 4 > 0)
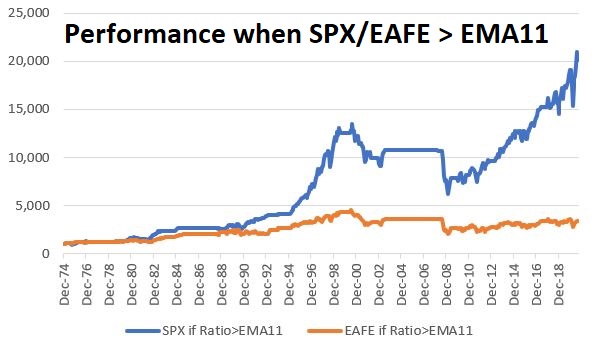
Figure 5 – SPX and EAFE performance while SPX/EAFE ratio > EMA11
Figure 6 displays the growth of equity for each index if held ONLY when EAFE is outperforming (i.e., when the line in Figure 4 < 0)
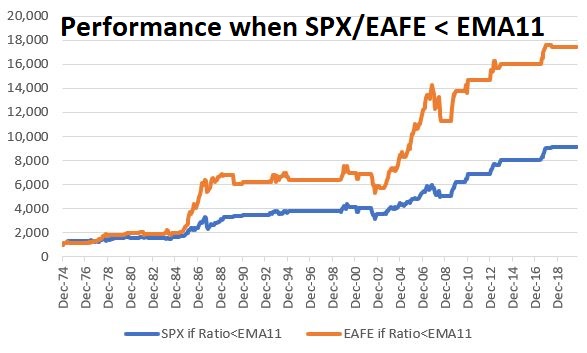
Figure 6 – SPX and EAFE performance while SPX/EAFE ratio < EMA11
Figure 7 displays the results in numbers
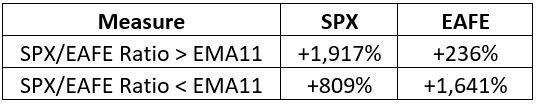
Figure 7 – SPX and EAFE performance based on SPX/EAFE ratio versus EMA11
The bottom line: SPX has vastly outperformed when the SPX/EAFE ratio > EMA11. Likewise, EAFE has significantly outperformed when the SPX/EAFE ratio < EMA11.
The Test
Now let’s look at actually using this information to trade.
Trading Rules:
If E > 0* then invest in SPX
If E < 0* then invest in EAFE
*- using a 1-month lag; i.e., a signal generated at the end of January is traded at the end of February
As a benchmark we will split 50/50 between SPX and EAFE with a rebalance to 50/50 at the start of each new year.
Figure 8 displays the growth of $1,000 for both the switching strategy and the Buy/Hold strategy.
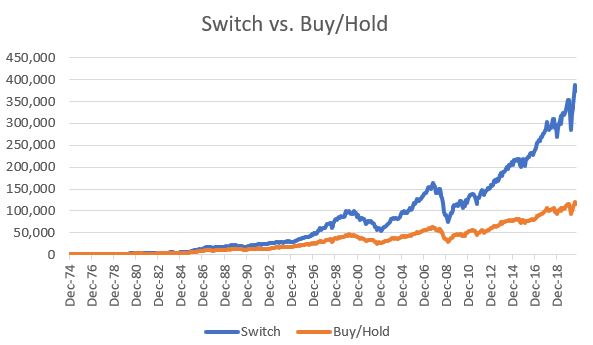
Figure 8 – Growth of $1,000 switching versus buy-and-hold (1974-2020)
Figure 9 displays the relevant facts and figures
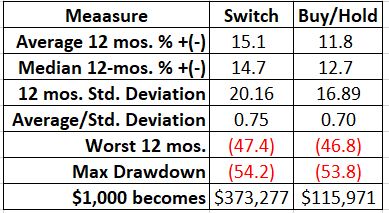
Figure 9 – Relevant Facts and Figures
Note that from a “risk” perspective, the “switch system” appear slightly worse, with a higher standard deviation and slightly worse worst 12 months and maximum drawdown figures.
But in terms of return there is no comparison. To illustrate, Figure 10 displays the cumulative growth for the “switch strategy” divided by the cumulative growth for the “buy/hold strategy”. Note the steadily upward trending nature of this line.
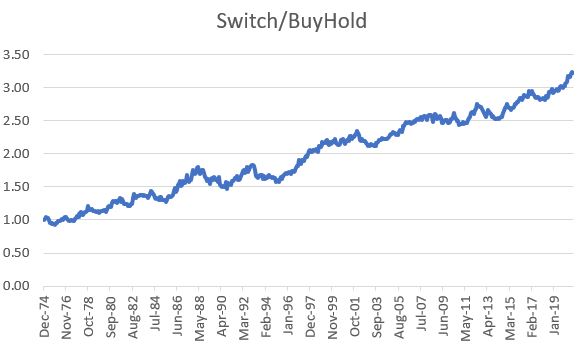
Figure 10 – Growth of “switch strategy” versus “buy/hold strategy”
Summary
Is this the “be all, end all” of investment strategies? With a maximum drawdown of -54% it obviously is not. But – as always – I am not actively suggesting that anyone adopt this as a trading method. The purpose is threefold:
*Food for thought (anything that outperforms buy-and-hold by a factor of 3.23-to-1 is at least worthy of a “ponder”)
*A reminder that U.S. stocks and international stocks have an ebb and flow
*This is one objective way to keep an eye on which way the wind is blowing
This “strategy” has been in SPX since July 2018 and shows no signs of a switch anytime soon. But the point remains – the day will come. And not many investors are prepared to act when that day does come.
See also Jay Kaeppel Interview in July 2020 issue of Technical Analysis of Stocks and Commodities magazine
See also Jay’s “A Strategy You Probably Haven’t Considered” Video
See also Video – The Long-Term…Now More Important Than Ever
Jay Kaeppel
Disclaimer: The information, opinions and ideas expressed herein are for informational and educational purposes only and are based on research conducted and presented solely by the author. The information presented represents the views of the author only and does not constitute a complete description of any investment service. In addition, nothing presented herein should be construed as investment advice, as an advertisement or offering of investment advisory services, or as an offer to sell or a solicitation to buy any security. The data presented herein were obtained from various third-party sources. While the data is believed to be reliable, no representation is made as to, and no responsibility, warranty or liability is accepted for the accuracy or completeness of such information. International investments are subject to additional risks such as currency fluctuations, political instability and the potential for illiquid markets. Past performance is no guarantee of future results. There is risk of loss in all trading. Back tested performance does not represent actual performance and should not be interpreted as an indication of such performance. Also, back tested performance results have certain inherent limitations and differs from actual performance because it is achieved with the benefit of hindsight.

