Some things are hard to explain. Yet, in the end we either take them at face value or we dismiss them. Take for instance:
*If the S&P 500 Index advances in November, December and January the market tends to be strong for the next 12 months
*If the S&P 500 Index advances in April, May and June the market tends to be strong for the next 9 months
Figure 1 displays the price performance for the S&P 500 Index in the 12-months following each time November, December AND January showed a gain. Figure 2 shows the cumulative growth.
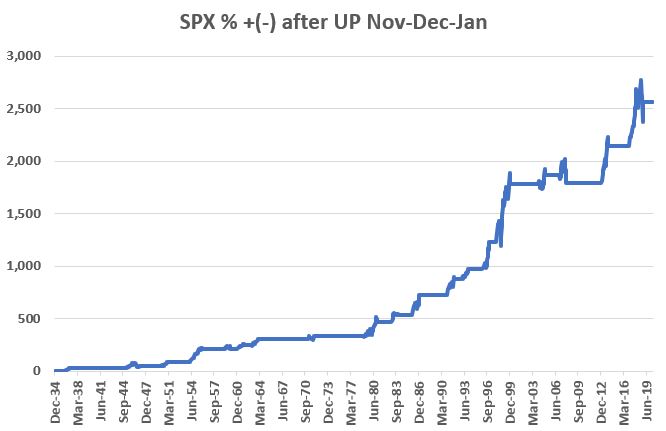
Figure 1 – Cumulative S&P 500 gain in 12 months after UP Nov, Dec and Jan
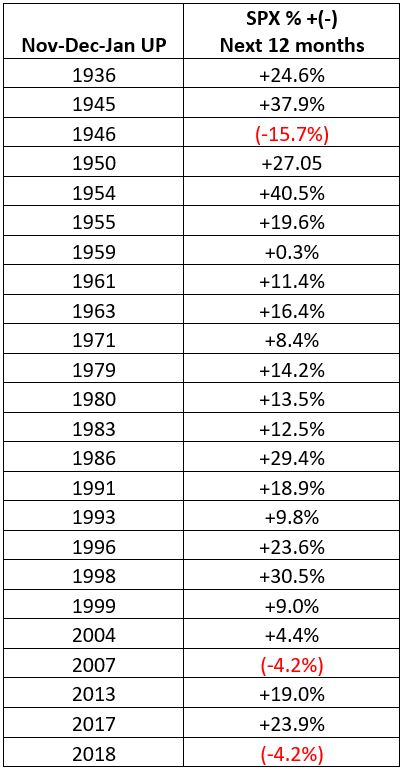
Figure 2 – S&P 500 in 12 months after UP Nov, Dec and Jan
Figure 3 displays the price performance for the S&P 500 Index in the 9-months following each time April, May AND June showed a gain. Figure 4 shows the cumulative growth.
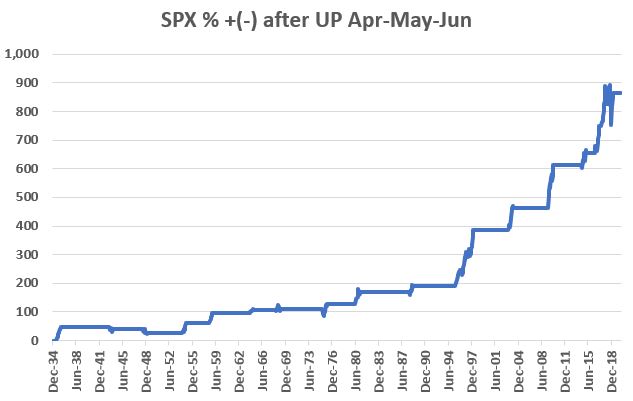
Figure 3 – Cumulative S&P 500 gain in 9 months after UP Apr, May and Jun
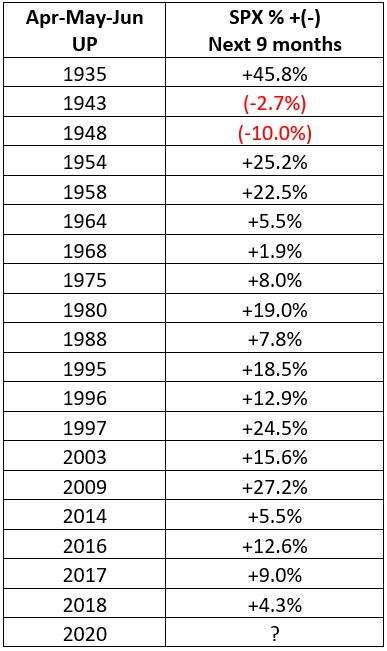
Figure 4 – S&P 500 in 9 months after UP Apr, May and Jun
Putting the Two Together
Now just for fun, let’s put the two together and see what the results would be if we were in the market ONLY following one of the two signals above. So for this test:
*If the S&P 500 Index shows a gain for November, December and January we will hold the S&P 500 for 12 months and if April, May and June show a gain we will hold the S&P 500 for 9 months.
Figure 5 displays the equity curve.
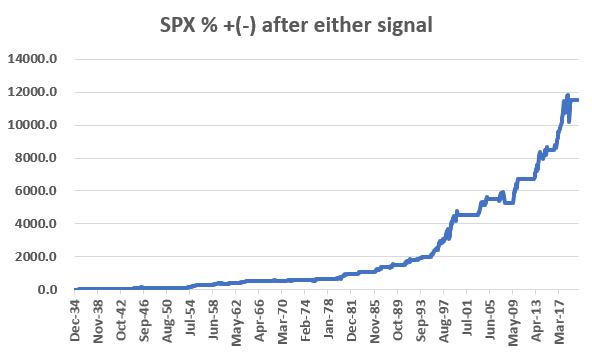
Figure 5 – S&P 500 cumulative % +(-) following all signals
The primary thing to note is the “Lower Left to Upper Right” nature of the equity curve.
Summary
As “Weight of the Evidence” tools, this simple momentum measures have proven to be very useful in identifying favorable times to be in the market. So does the fact that April, May and June of 2020 all showed a gain guarantee that the stock market will be higher by the end of March 2021?
Not at all. Every time out is its own roll of the dice. But history clearly suggests that we should give the bullish case the benefit of the doubt for now.
See also Jay Kaeppel Interview in July 2020 issue of Technical Analysis of Stocks and Commodities magazine
See also Jay’s “A Strategy You Probably Haven’t Considered” Video
See also Video – The Long-Term…Now More Important Than Ever
Jay Kaeppel
Disclaimer: The information, opinions and ideas expressed herein are for informational and educational purposes only and are based on research conducted and presented solely by the author. The information presented represents the views of the author only and does not constitute a complete description of any investment service. In addition, nothing presented herein should be construed as investment advice, as an advertisement or offering of investment advisory services, or as an offer to sell or a solicitation to buy any security. The data presented herein were obtained from various third-party sources. While the data is believed to be reliable, no representation is made as to, and no responsibility, warranty or liability is accepted for the accuracy or completeness of such information. International investments are subject to additional risks such as currency fluctuations, political instability and the potential for illiquid markets. Past performance is no guarantee of future results. There is risk of loss in all trading. Back tested performance does not represent actual performance and should not be interpreted as an indication of such performance. Also, back tested performance results have certain inherent limitations and differs from actual performance because it is achieved with the benefit of hindsight.

