As you can see in Figure 1, long-term treasuries (using ticker TLT as a proxy) have had a very good year so far in 2020 (Thank You Fed!).
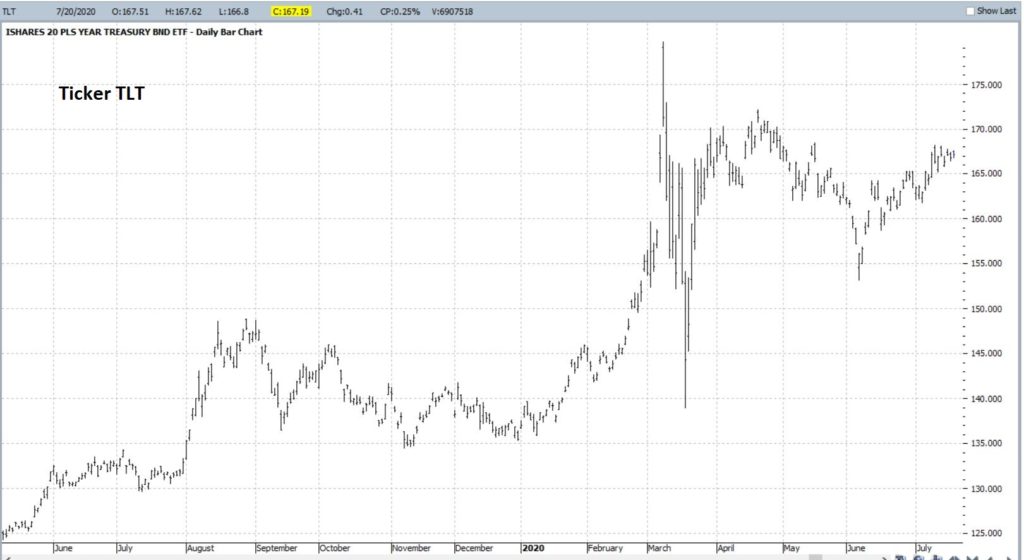
Figure 1 – Ticker TLT (Courtesy ProfitSource by HUBB)
As you can see in Figure 2, t-bonds are soon going to enter their most seasonally favorable time of the year – between early August and the end of September.
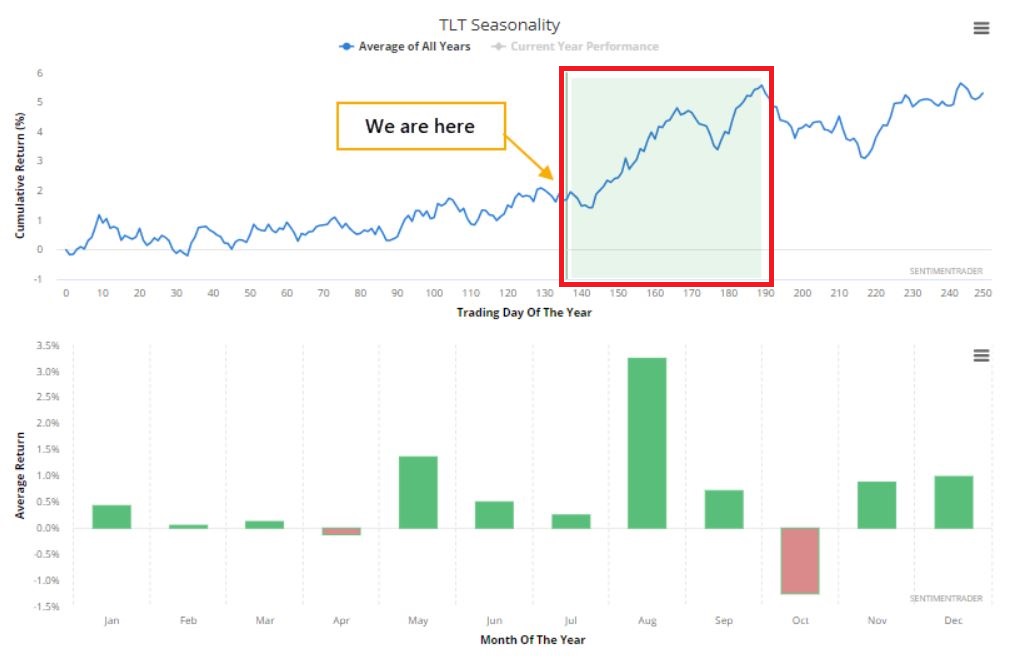
Figure 2 – T-Bond Seasonal Pattern (Courtesy Sentimentrader.com)
There are two things to note. First, seasonality is “climate, not weather” – in other words there is never any guarantee that a particular seasonal trend will work well “the next time around.” Secondly – and exactly to that point – for the record, it hasn’t been a great year for seasonality. When the stock market was “supposed to” go up, it went down and when it is “supposed to be” going down it is going up, not to mention a few others.
Finally, the “spike” top that TLT made in early March and the “Island Reversal” top it made in late April looks like some pretty formidable “resistance.” So, I am not so sure that I would “bet the house” (Note to myself: Get back to those “Quotation Marks Anonymous” meetings after this “Covid thing” blows over) on a big seasonal bull move in bonds.
But here is the point: In the world of options one does not have to make a “big play.”
An Example Play in TLT
First off – and as always – what follows is NOT a “recommendation”. It is simply an example of one way to make a low dollar risk bet on something that you might not otherwise touch. For example, remember that with TLT trading at $167.19 a share, 100 shares would require a $16,719 commitment. A trader who might be interested in playing a bullish seasonal trend might decide to “take a pass” rather than making that large of a commitment.
Enter options.
The example trade below involves:
Buying 2 Oct16 TLT call @ $2.10
Selling 3 Oct16 TLT calls @ $0.61
Buying 1 Oct16 TLT call @ $0.33
This is an example of a Out-of-the-money butterfly spread (usually done 1 by 2 by 1, but in many cases a 2 by 3 by 1 spread offers the potential for more profit at a slightly higher cost).
The particulars are displayed din Figure 3 and the risk curves in Figure 4.
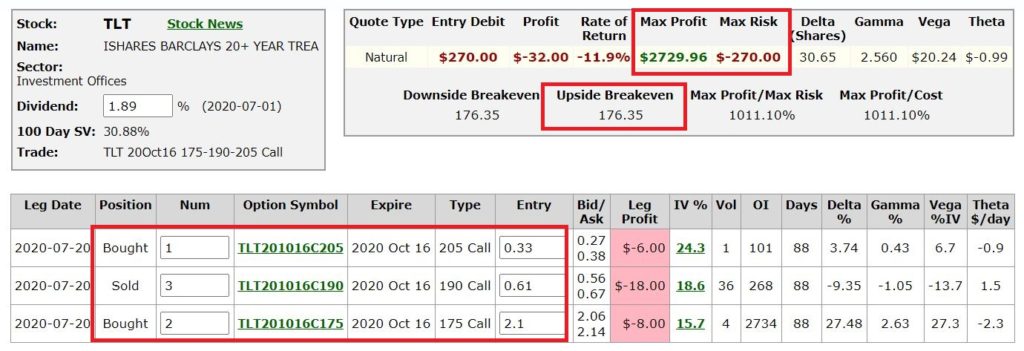
Figure 3 – TLT Butterfly details (Courtesy www.OptionsAnalysis.com)
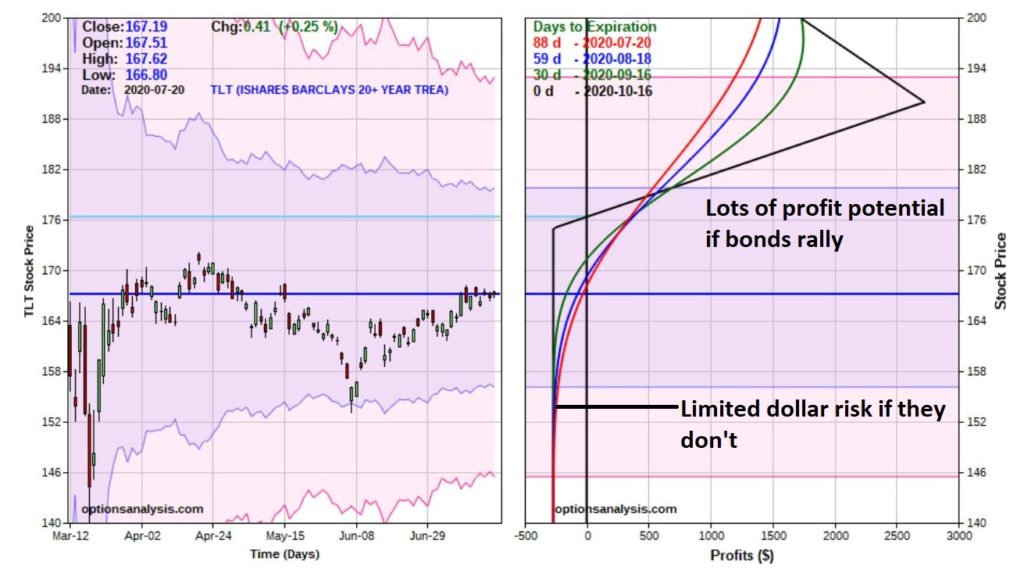
Figure 4 – TLT risk curves (Courtesy www.OptionsAnalysis.com)
Things to note:
*This trade represents a $270 speculation that t-bonds will in fact rise between now and mid-October. If they do not, this trade will lose 100% of its $270 cost.
*Still, we are talking a $270 cost and maximum risk, versus committing $16,000+ to simply buy 100 shares of TLT
*While the maximum profit potential of $2,730 is enticing it is important to note that that is entirely unlikely to be realized for two reasons: 1) TLT would have to close at exactly $190 a share on 10/16 for that to happen, and, 2) we will not likely hold this trade until expiration (because the “seasonally favorable” period ends in late September).
So, to get a more “real feel” for “where this trade lives” (Wow, I really “need help”) let’s consider what the risk curves look like at the end of September, i.e., with 16 days left until options expiration. See Figure 5.
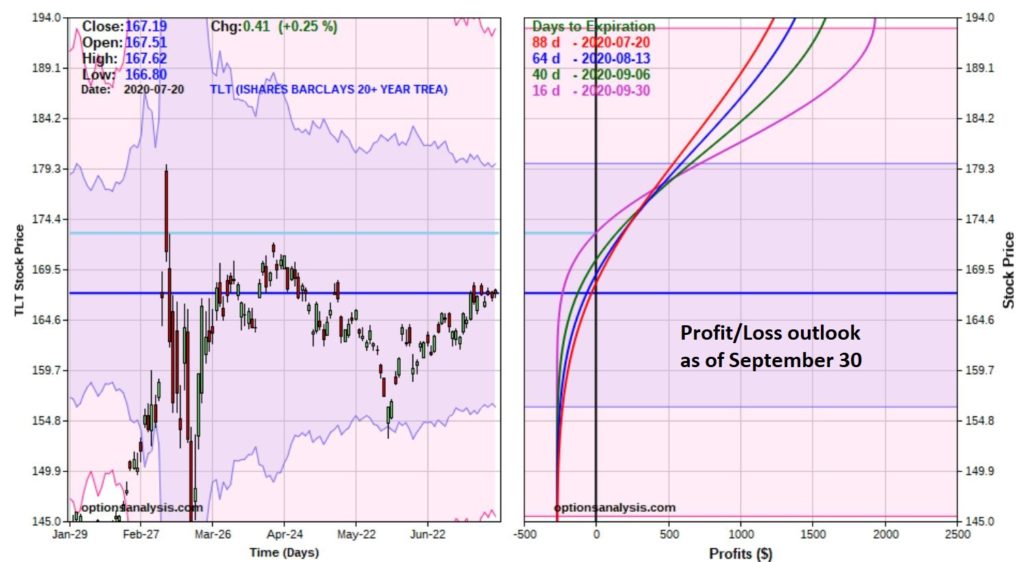
Figure 5 – TLT risk curves as of 9/30 (Courtesy www.OptionsAnalysis.com)
We see that:
*Whatever else happens the worst-case scenario is a loss of $270
*Profits can accumulate very quickly if TLT does in fact rise
Summary
Is it a good idea to bet on TLT rising in the next several months? That is not for me say. That up to each individual trader to decide for themselves. But if a trader decides the answer is “Yes”, or even just “Maybe”, then the OTM butterfly offers an alternative to ponying up 16 grand to find out.
See also Jay Kaeppel Interview in July 2020 issue of Technical Analysis of Stocks and Commodities magazine
See also Jay’s “A Strategy You Probably Haven’t Considered” Video
See also Video – The Long-Term…Now More Important Than Ever
Jay Kaeppel
Disclaimer: The information, opinions and ideas expressed herein are for informational and educational purposes only and are based on research conducted and presented solely by the author. The information presented represents the views of the author only and does not constitute a complete description of any investment service. In addition, nothing presented herein should be construed as investment advice, as an advertisement or offering of investment advisory services, or as an offer to sell or a solicitation to buy any security. The data presented herein were obtained from various third-party sources. While the data is believed to be reliable, no representation is made as to, and no responsibility, warranty or liability is accepted for the accuracy or completeness of such information. International investments are subject to additional risks such as currency fluctuations, political instability and the potential for illiquid markets. Past performance is no guarantee of future results. There is risk of loss in all trading. Back tested performance does not represent actual performance and should not be interpreted as an indication of such performance. Also, back tested performance results have certain inherent limitations and differs from actual performance because it is achieved with the benefit of hindsight.


Very nice collection of conservative input numbers with excellent rewards in the event of a rally. Well done Jay.
Douglas in Texas.