The old adage is that we should “buy when there is blood in the streets.” It basically means to buy when things look their worst. Well, for the record I am not actually a fan of this intonation. While it is probably a fair statement, I for one prefer to see some sign of hope – some sign of a trend reversal at the very least – before taking the plunge.
One historically useful indicator suggests we may be nearing that point.
I refer to this indicator as JKHiLo. I included my initials in the acronym because I “developed” it. OK, all I really did was take one guy’s useful indicator and multiply it by another guy’s useful indicator and voila.
In a nutshell JKHilo multiplies Norman Fosback’s HiLo Logic Index by Gerald Appel’s High/Low Indicator.
The Fosback HiLo Logic Index (FHLLI)
I wrote two articles here and here about this indicator. In short, a very low number of stocks making new lows is bullish for the stock market – it indicates that stocks overall are going up and is bullish. At the same time, a very low number of stocks making new highs is also (typically) ultimately bullish going forward, as it tends to signal a “washed out” market.
So this indicator:
*takes the lower of new highs and new lows each day
*divides that number by the total number of issues trades
*takes a 10-day moving average of daily readings
Specifically, the Fosback HiLo Logic Index (HLLI) is calculated as follows:
A=Daily Nasdaq New Highs
B=Daily Nasdaq New Lows
C=The lower of A and B
D=The total number of Nasdaq issues traded
E = (C / D) * 100
FHLLI = 10-day average of E
Readings above 2.15% are considered a sign of “churning”, i.e., a lot of new highs AND new lows. Reading below 0.40% are considered “bullish” because either new highs OR new lows is very low.
The Fosback HiLo Logic Index finally dropped below 0.40% on 3/23/20. Figure 1 displays the OTC Composite Index with this indicator through 12/31/2019.
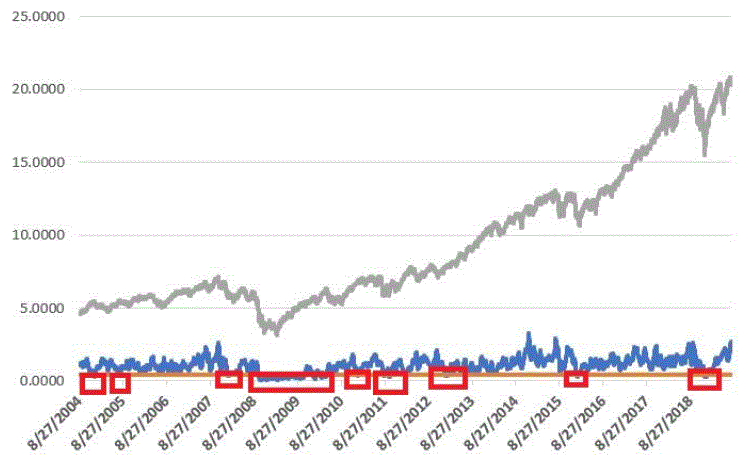
Figure 1 – Fosback HiLo Logic Index
The Appel High/Low Indicator
This indicator (heretofore AHLI) is more of a trend-following indicator. It simply divides the number of new highs each day by the total of new highs AND new lows, then takes a 10-day average.
The AHLI is calculated as follows:
A=Daily Nasdaq New Highs
B=Daily Nasdaq New Lows
C = A / (A+B)
AHLI = 10-day average of C
Figure 2 displays this indicator versus the OTC Composite from 12/29/17 through 3/23/20.
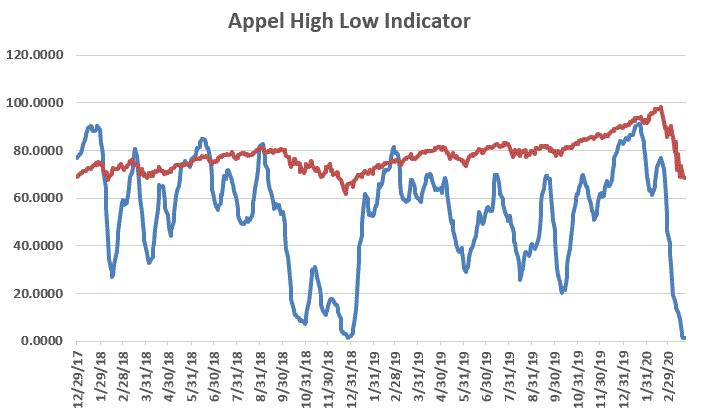
Figure 2 – Appel High/Low Indicator (x100; blue line) with OTC Composite (/100; red line); Dec17 through 3/23/20
Extremely low readings tend to highlight oversold market conditions. For the record, an actual “buy signal” for this indicator occurs when it drops below 0.20 (or 20 in Figure 3 since the blue line is the indicator x 100) and then rises back above that level.
The JK Hilo Index (JKHiLo)
So then one day some young punk comes along and multiplies the Fosback indicator by the Appel indicator and has the audacity to add his own initials. Some people. Anyway:
JKHiLo = (FHLLI x AHLI) x 500
A “12-month Buy Signal” occurs when this indicator:
*drops below 5.00
*then turns higher for one day
The first part of this signal has happened. As of the close on 3/23/20 JKHL has plunged to 1.8.
Let’s look at previous instances when JKHL fell below 5.00 and then ticked higher for one day.
IMPORTANT: This upside reversal technically constitutes a “12-month buy signal”. What does that mean? It means:
*We expect the market to be higher 12-months later
*HOWEVER, it is NOT an “All Clear, Everything is Great, You Can’t Lose” signal
The bottom line is that it typically does NOT mark the actually bottom. In most cases, another new low or at least a retest of the low follows within a few months. But not always.
Figure 3 displays the 7 buy signals that have occurred since 1990.
A = Date of signal – i.e., date the JKHL indicator ticked up one day after dropping below 5
B = SPX closing price on date of signal
C = Subsequent low closing price for SPX
D = SPX closing price 12 months after signal date
E = # of trading days between date of signal and ultimate low
F = % decline by SPX from date of signal to ultimate low
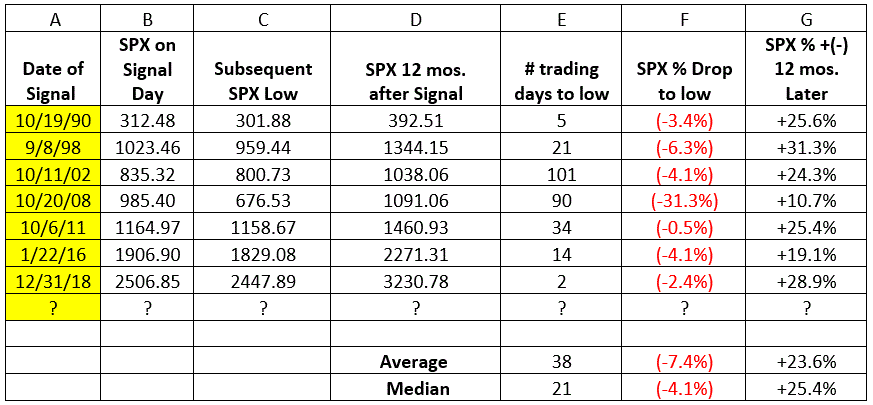
G = % change in SPX closing price 1 year after date of signal
Figure 3 – JKHL 12-month buy signals
It is important to note that each previous “buy signal” was followed by further downside price movement prior to the ultimate low. It ranged from 2 trading days in 2018 to 101 trading days in 2008. 6 of the 7 signals saw a further decline of no more than -6.3%. But the 2008 signal saw the market continue to plunge another -31% of the following 3+ months.
So, like I said earlier, even when this indicator does turn up and generate a new signal, that DOES NOT mean “All Clear”. Still, to get an idea of what we might expect, each of the previous signals are displayed in the Figures below.
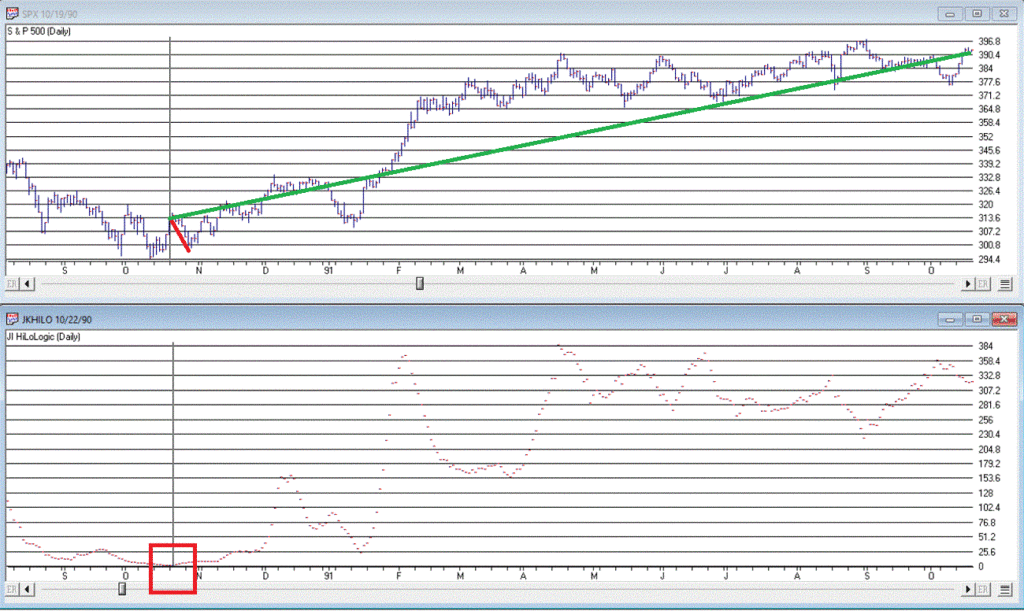
Figure 4 – 1990 signal (-3.4% to low, +25.6% 12 months later)
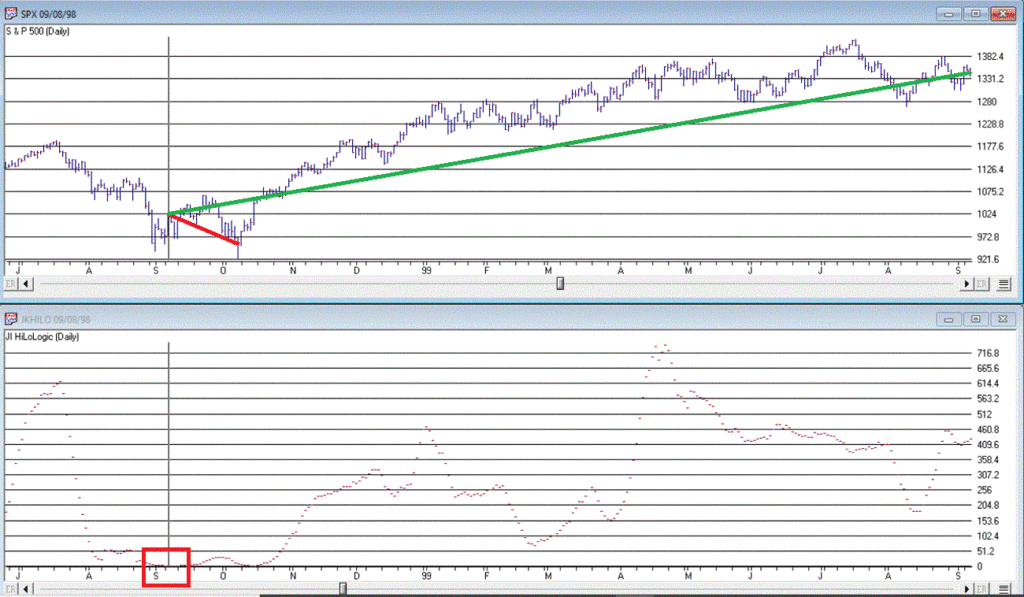
Figure 5 – 1998 signal (-6.3% to low, +31.3% 12 months later)
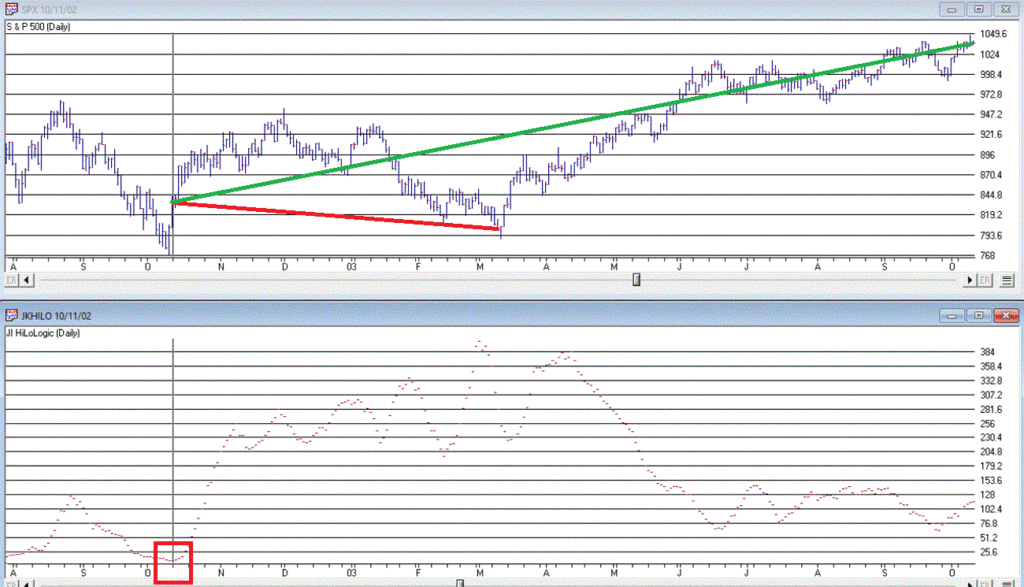
Figure 6 – 2002 signal (-4.1% to low, +24.3% 12 months later)

Figure 7 – 2008 signal (-31.3% to low, +10.7% 12 months later)
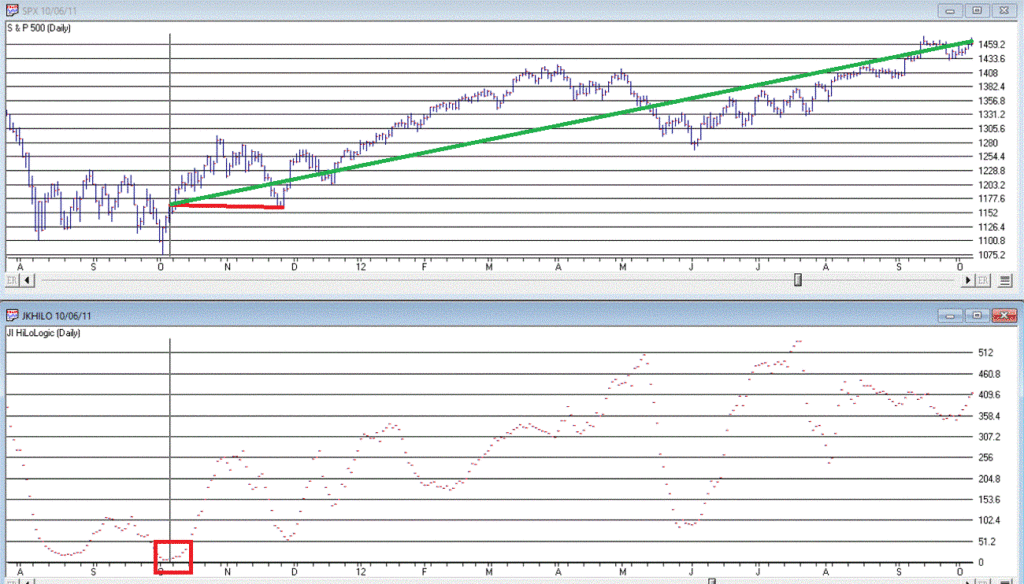
Figure 8 – 2011 signal (-0.5% to low, +25.4% 12 months later)
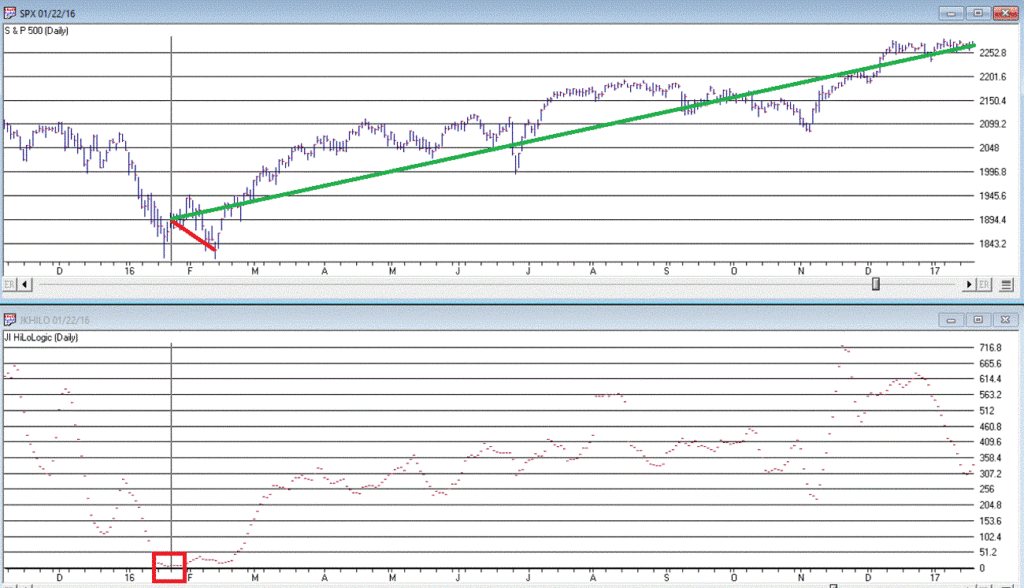
Figure 9 – 2016 signal (-4.1% to low, +19.1% 12 months later)
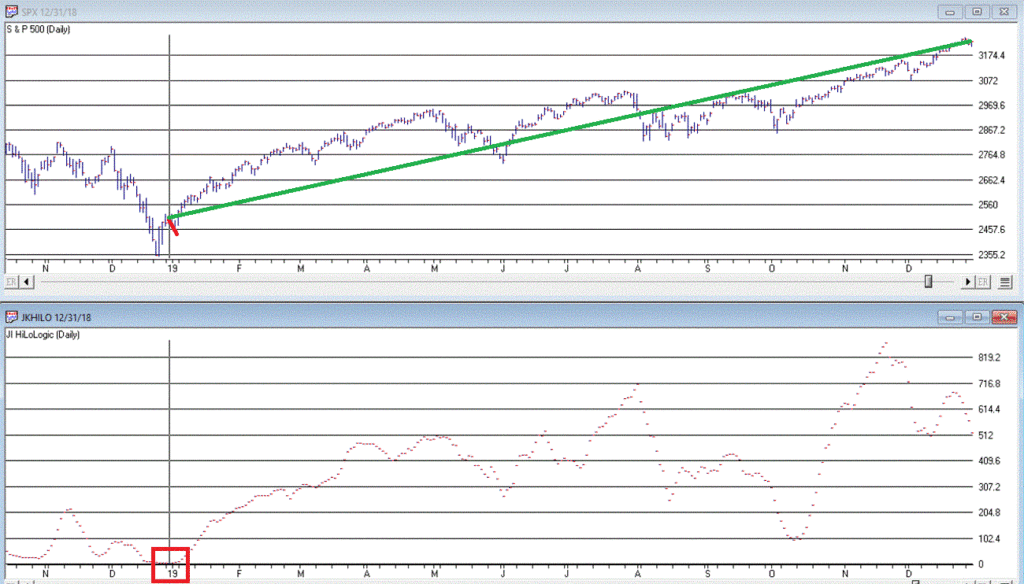
Figure 10 – 2018 signal (-2.4% to low, +28.9% 12 months later)
We DO NOT have a new signal yet, but JKHiLo is below 5, so it is just a matter of waiting for the daily value to tick higher for one day (and then – if history is a guide – waiting for the ultimate low to be put in before a subsequent rally).
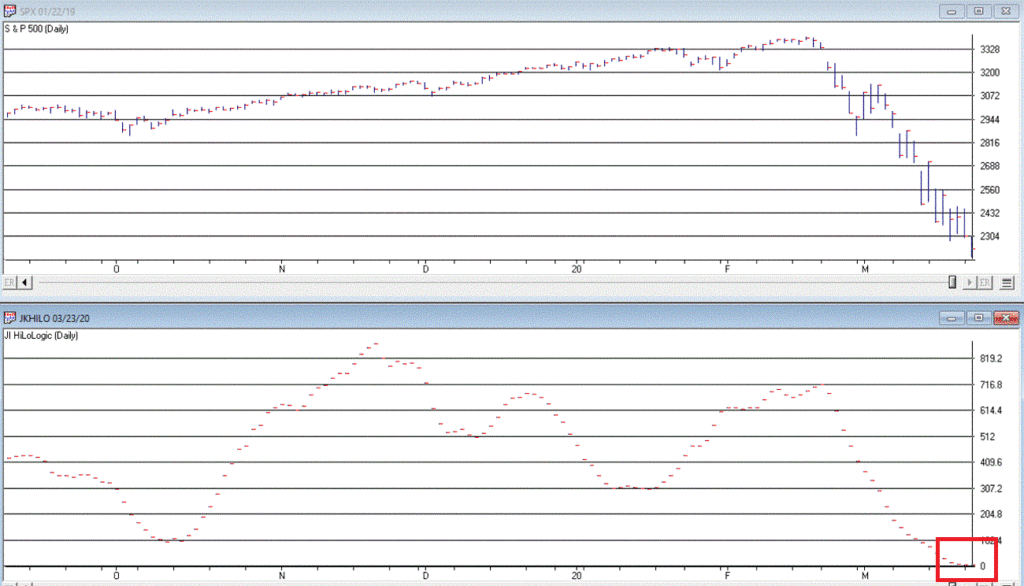
Figure 11 – As of 3/23/20
Summary
Are we on the cusp of a new opportunity? Or on the edge of a cliff? In this time of unprecedented uncertainty, I can’t pretend to know the answer. So, I rely on objective indicators to guide me.
At this moment in time the “trend-following” indicators are bearish and so caution is undoubtedly in order. But other indicators such as the one discussed here remind us to remain alert to new opportunities.
Jay Kaeppel
Disclaimer: The information, opinions and ideas expressed herein are for informational and educational purposes only and are based on research conducted and presented solely by the author. The information presented does not represent the views of the author only and does not constitute a complete description of any investment service. In addition, nothing presented herein should be construed as investment advice, as an advertisement or offering of investment advisory services, or as an offer to sell or a solicitation to buy any security. The data presented herein were obtained from various third-party sources. While the data is believed to be reliable, no representation is made as to, and no responsibility, warranty or liability is accepted for the accuracy or completeness of such information. International investments are subject to additional risks such as currency fluctuations, political instability and the potential for illiquid markets. Past performance is no guarantee of future results. There is risk of loss in all trading. Back tested performance does not represent actual performance and should not be interpreted as an indication of such performance. Also, back tested performance results have certain inherent limitations and differs from actual performance because it is achieved with the benefit of hindsight.


Fascinating and full of insight, Jay. Thank you as always for making the effort to share this knowledge.
WOW, and I thought that I was really into the the markets . There should be a clinical condition honorarily named after you. This is next level compulsion driven insight.
Keep them coming J.
Another view of “climactic selling” can be seen in a study of highest ranking, largest percent “quarterly losses”
– When the SP500 has produced a large quarterly loss, the resulting SP500 price fell below and resided below its long length moving average ( monthly basis, month end close ).
– When the SP500 price crossed back “above” the moving average ( the longest wait time between quarterly loss produced and MA cross being 9 months in 1946, as shown in link ), decent forward 1, 2, and 5 year returns ensued.
4th quarter 2018 was the most recent with ma cross month end February 2019 – it’s continuity being upset by recent events. The close of next Tues will determine if 1st quarter 2020 was a large enough quarterly loss to warrant attention
https://imgur.com/a/RNQVY4I
James, Pretty interesting. Thanks for posting! Jay
I have the 1986 edition of Stock Market Logic and I can’t find his Hi Lo Logic index at all. The only mention he makes about highs and lows is on pages 118-120 and he concludes that highs and lows provide little useful information. Very puzzling.
Howard, I don’t think he actually wrote about it in that book. I think he came with it several years after the book came out. Jay