I am not going to claim to have “called the top” or anything silly like that. But I for one was not surprised to see the stock market sell-off recently, based almost entirely on the reading of one “venerable” indicator.
The HiLo Logic Index
The HiLo Logic index (heretofore “HLLI”) was first introduced by market legend Norman Fosback (his 1975 book titled “Stock Market Logic” still holds a prominent place in my library. Now for the record, Mr. Fosback introduced the indicator using NYSE data, and for some reason that I can’t recall, somewhere along the way I started following only the Nasdaq version of this indicator. So that is the one I will highlight here.
The HLLI is calculated as follows:
A=Daily Nasdaq New Highs
B=Daily Nasdaq New Lows
C=The lower of A and B
D=The total number of Nasdaq issues traded
E=(C/D)*100
HLLI=10-day average of E
In a nutshell, it takes the “lower” of daily new highs and daily new lows and multiplies that value by 100. It then uses a 10-day simple average of those daily readings as the HiLo Logic Index.
For our purposes, a HLLI reading of 2.15 or higher is considered a bearish “warning sign”. The idea is that when both new highs and new lows are relatively high it represents a sign of “churning” in the marketplace – typically a bad sign. Tops in the stock market – even short and intermediate-term ones – are often accompanied by churning in the market, i.e., alot of indecisive action.
Think of it this way:
*When alot of stocks are making new highs and very few are making new lows, that is bullish
*When alot of stocks are making new lows and very few are making new highs, this (interestingly) is also typically bullish (as it represents a “wash out” in the market)
*On the other hand, when alot of stocks are making new highs AND alot of stocks are making new lows at the same time, this is often a sign of a market in turmoil and that may be transitioning from bullish to bearish.
The HLLI is a handy way to keep track.
Results
For our purposes we will use the Nasdaq Composite Index (which includes all Nasdaq listed stocks) to measure performance. Figure 1 displays the Nasdaq HLLI against the Nasdaq Composite from 1988 into August of 2004. Figure 2 displays the same from August 2004 forward.
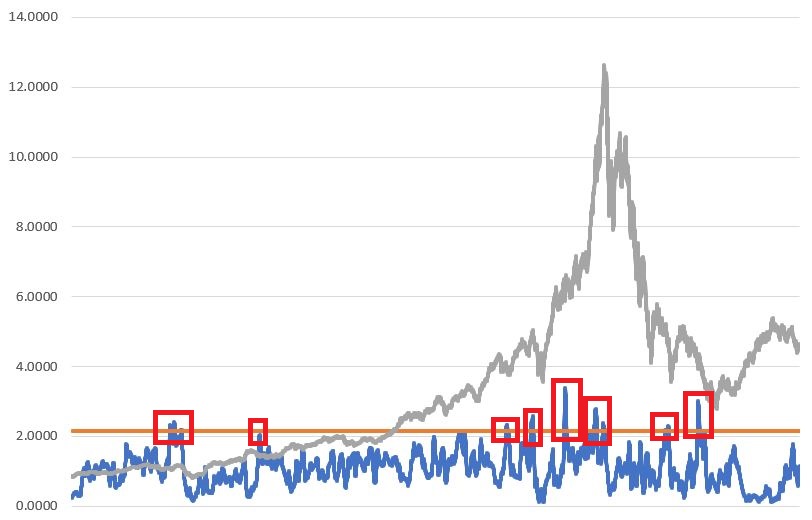 Figure 1 – OTC Composite with HiLo Logic Index (Jan 1988-Aug 2004)
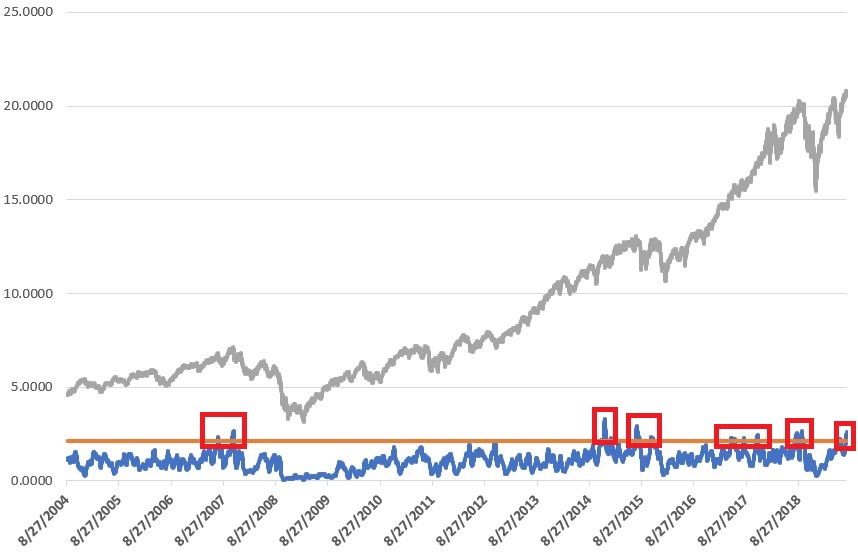 Figure 2 – OTC Composite with HiLo Logic Index (Aug 2004-Aug 2019)
Figure 3 displays the average % gain or loss for the Nasdaq Composite for various time frames based on current readings for the HLLI.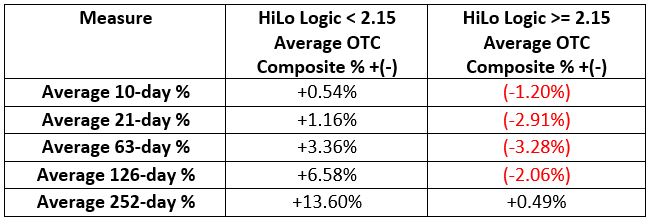 Figure 3 – Average % +(-) following various HLLI readings (1988-2019)
Figure 4 displays the % of time the Nasdaq Composite showed a gain x-days after a given HLLI reading.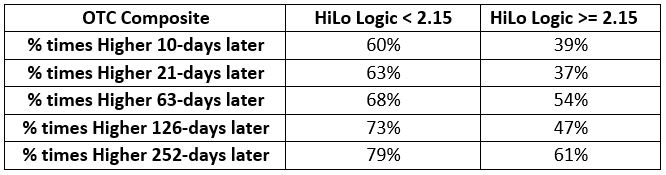 Figure 4 – % of times OTC Composite higher following various HLLI readings (1988-2019)
As you can see in Figure 3 and 4 the market has displayed a definite tendency to perform more poorly following a HLLI reading of 2.15 or higher.
As you can see in Figure 5, the HLLI rose to a bearish level in August and September of 2018, warning of the trouble in the 4th quarter of 2018 that took most investors by surprise. The HLLI returned to a bearish level in July of 2019 – just prior to the latest selloff and remained in bearish territory (i.e., above 2.15) after the second day of trading in August 2019.
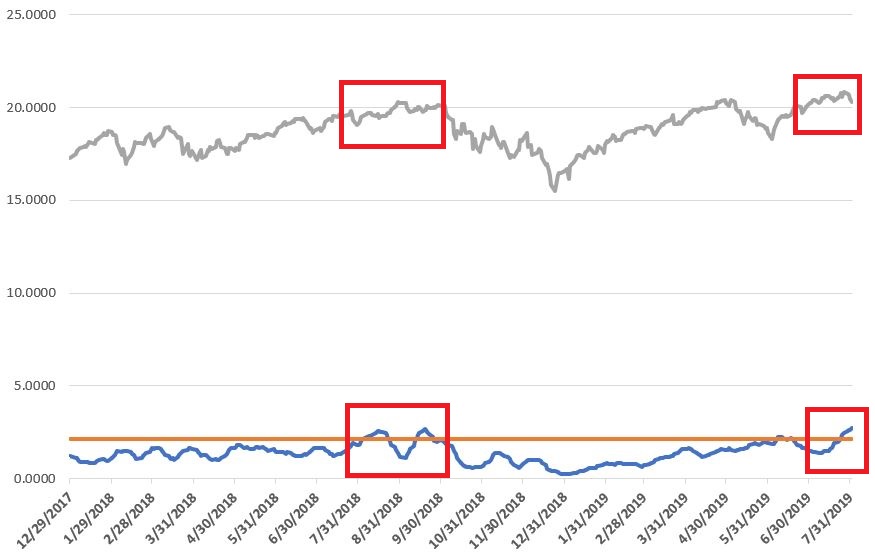 Figure 5 – OTC Composite with HiLo Logic Index
Summary
As you can see in Figures 1 and 2, a bearish HLLI reading has presaged most severe bear markets as well as periods when a market that had been advancing nicely stops doing so for a meaningful period of time. The reality is that most severe bear markets are presaged by a bearish HLLI reading, HOWEVER, not every bearish HLLI reading presages a severe bear market. 2017 was a major exception to the rule as the HLLI had several periods of bearish readings and the market just kept plowing higher.
Still, the readings in Figures 3 and 4 strongly suggest that a bearish HLLI index should at a minimum cause investor’s to temper their bullishness for at least a little while.
Jay Kaeppel
Disclaimer: The data presented herein were obtained from various third-party sources. While I believe the data to be reliable, no representation is made as to, and no responsibility, warranty or liability is accepted for the accuracy or completeness of such information. The information, opinions and ideas expressed herein are for informational and educational purposes only and do not constitute and should not be construed as investment advice, an advertisement or offering of investment advisory services, or an offer to sell or a solicitation to buy any security.

