In this article I wrote about the fact that an indicator with a history recently forewarned of trouble in the stock market. That indicator – know as the HiLo Logic Index – first popularized by Norman Fosback (the author of the 1975 classic, “Stock Market Logic”) sometime back in the 1980’s, recently reached a level that suggested “churning” in the stock market. Churning is typically a bad thing for the stock market as it indicates a high degree of complacency and/or lack of direction in the underlying market.
The good news is that the same indicator sometimes gives very bullish signals. In this article we will take a look at that end of the spectrum.
The HiLo Logic Index
Quick review: The HiLo Logic index (heretofore “HLLI”) was first introduced by market legend Norman Fosback (his 1975 book titled “Stock Market Logic” still holds a prominent place in my library. Now for the record, Mr. Fosback introduced the indicator using NYSE data, and for some reason that I can’t recall, somewhere along the way I started following only the Nasdaq version of this indicator. So that is the one I will highlight here.
The HLLI is calculated as follows:
A=Daily Nasdaq New Highs
B=Daily Nasdaq New Lows
C=The lower of A and B
D=The total number of Nasdaq issues traded
E=(C/D)*100
HLLI=10-day average of E
In a nutshell, it takes the “lower” of daily new highs and daily new lows and multiplies that value by 100. It then uses a 10-day simple average of those daily readings as the HiLo Logic Index.
For our purposes, a HLLI reading of 2.15 or higher is considered a bearish “warning sign”. The idea is that when both new highs and new lows are relatively high it represents a sign of “churning” in the marketplace – typically a bad sign. On the other end of the spectrum, a reading of 0.40 or less us considered a bullish sign, as it indicates that either:
*A very low number of stocks have recently been making new lows (which is obviously bullish), or
*A very low number of stocks are making new highs (which counter-intuitively is also bullish as this type of action tends to occur during a “washout” in the overall market – which often marks a bottom.
Results
For our purposes we will use the Nasdaq Composite Index (which includes all Nasdaq listed stocks) to measure performance. Figure 1 displays the Nasdaq HLLI against the Nasdaq Composite from 1988 into August of 2005. Figure 2 displays the same from August 2005 forward.
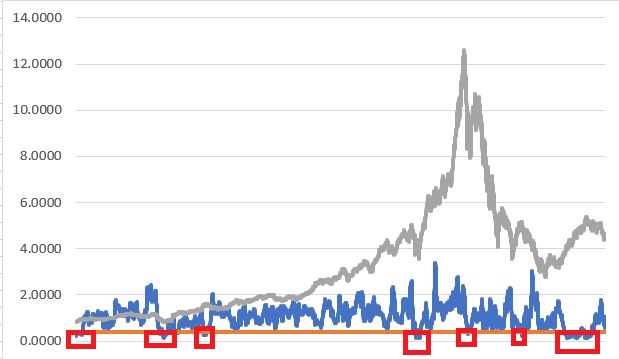 Figure 1 – OTC Composite Index with HLLI readings under 0.40 (1988-2004)
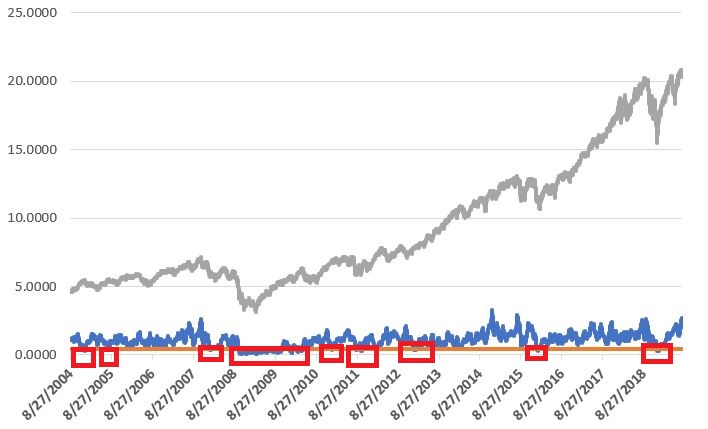 Figure 2 – OTC Composite Index with HLLI readings under 0.40 (2004-present)
Figure 3 displays the average % gain or loss for the Nasdaq Composite for various time frames based on current readings for the HLLI.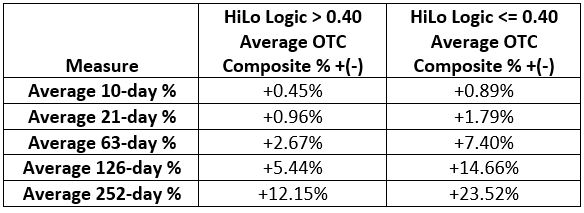 Figure 3 – OTC Composite performance following various HLLI readings (1988-2019)
Figure 4 displays the % of time the Nasdaq Composite showed a gain x-days after a given HLLI reading.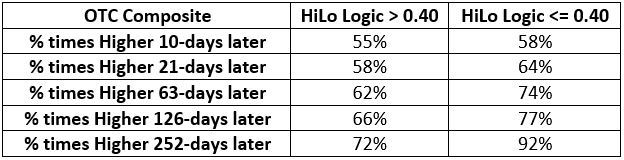 Figure 4 – OTC Composite performance following various HLLI readings (1988-2019)
As you can see in Figure 5, the HLLI felt to a bullish level in early 2016 – marking a significant low just prior to the 2016-2017 bull market and again in December 2018 – presaging the 2019 rally.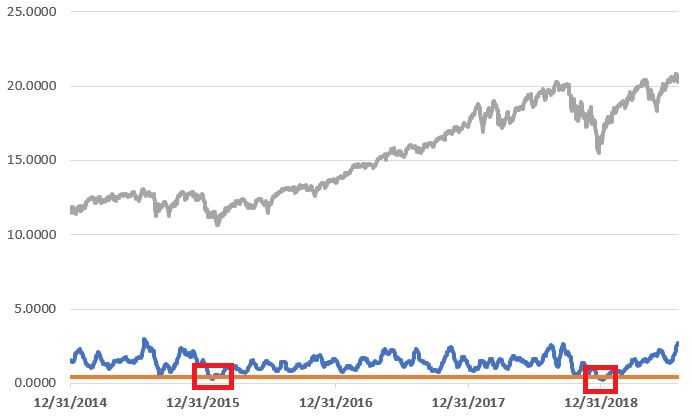 Figure 5 – OTC Composite Index with HLLI readings under 0.40 (2015-present)
Summary
No indicator is infallible. At times the HLLI can be too early wit a bullish or bearish reading. As such I use this more as a “perspective” indicator – since it tends to give signals when either, a) emotions are running high (at a low) or, b) when complacency is high (prior to a market slowdown or pullback or outright bear market – than as an “automatic” buy or sell trigger.
Still, it is worth noting that – as shown in Figures 3 and 4 – when the HLLI has dropped below 0.40, the OTC Composite has on average been higher one year later 92% of the time with an average gain of +23.52%. Not bad odds.
As I write (in the 2nd week of August 2019), the Nasdaq HLLI is still in “bearish territory” at 2.45 (above the 2.15 “bearish” alert level).
Jay Kaeppel
Disclaimer: The data presented herein were obtained from various third-party sources. While I believe the data to be reliable, no representation is made as to, and no responsibility, warranty or liability is accepted for the accuracy or completeness of such information. The information, opinions and ideas expressed herein are for informational and educational purposes only and do not constitute and should not be construed as investment advice, an advertisement or offering of investment advisory services, or an offer to sell or a solicitation to buy any security.

