The two questions on most investor’s minds (OK, beyond “What’s on Netflix” and “How is my stock of toilet paper holding up”?) are “what happens from here” and “how bad does this get”?
Sadly, the correct answer to both questions is “nobody knows.” Still, we can look at the history of bear markets and at least get a sense of the possibilities. Not to give anything away, but the short answer is “probably not good in the near term” but we should be optimistic for the long-term.
History of Bear Markets
For this exercise we will purposely avoid any subjective prognostication. In other words, I will avoid phrases like “expect a global depression” on the pessimistic side and “we should be near a bottom” on the optimistic side.
We will simply look at previous bear market:
*How long they lasted
*How far they fell
*How they did after the bottom
*And finally, how the current situation would play out if it followed each previous example
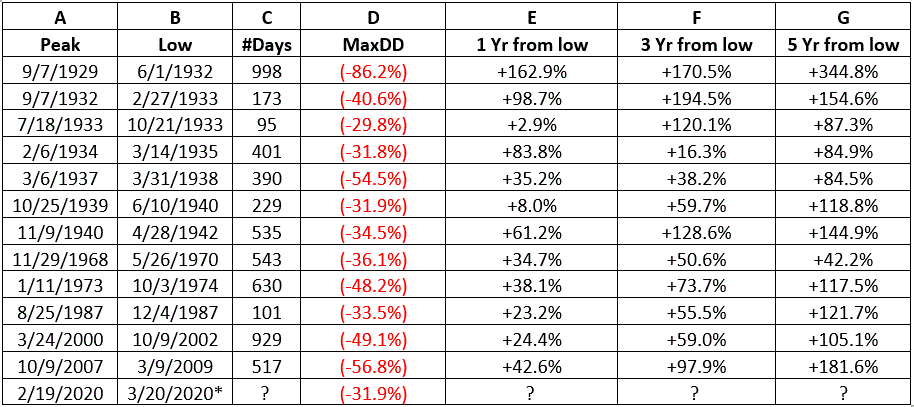
First the historical record. Figure 1 displays previous bear markets:
A = Bull market peak date
B = Bear market bottom date
C = # of calendar days from peak to bottom
D = % decline from Peak date to bottom date
E = % gain 1 year after low
F = % gain 3 years after low
G = % gain 5 years after low

Figure 1 – Major Historical Bear Markets
*The “smallest” bear market on this list was the 1933 sell off that lasted only 3 months and fell -29.8%
*The “worst” bear market was the 1929-1932 decline that lasted 2.75 years and saw the Dow plummet -86.2%
*3 of the 12 bear markets listed declined no more than -31.9%, which is how far the S&P 500 Index has fallen so far since the February 2020 high
If History Repeats
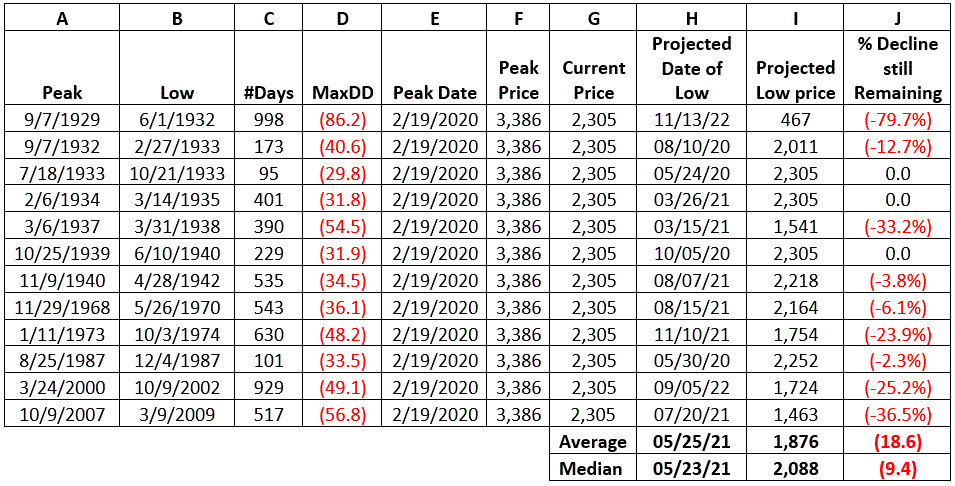
Now let’s use history to hypothetically project forward. Each row of Figure 2 below assumes that the current bear market plays out exactly like the bear market listed in that line (based on the close of 2,305 for the S&P 500 Index on 3/20/20).
A = Bull market peak date
B = Bear market bottom date
C = # of calendar days from peak to bottom
D = % decline from Peak date to bottom date
E = Peak date for recent bull market
F = Peak closing price for recent market
G = 3/20/20 closing price for S&P 500 Index
H = Projected date of low based on Column C
I = Projected low price based on Column D
J = Projected further price decline for S&P 500 Index from Column G to Column I

Figure 2 – Project forward from here, using each previous bear market as a template
*The first line in the table – i.e., the 1929-1932 Crash is pretty unsettling. If the market plays out from here exactly like it did then the S&P 500 will decline another -79.7% (from 2305 to 467!) before bottoming out. Scary stuff, indeed.
*At the same time, note that 6 of the 12 bear markets listed bottomed out no more than -6.1% from the current level of decline.
*If the current decline followed the “Average” decline, the market will bottom out May 25th of next year, at 1,876, or -18.6% below the current price level
*If the current decline followed the “Median” decline, the market will bottom out May 23rd of next year, at 2.088, or -9.4% below the current price level
HOWEVER, remember these are not “forecasts” or predictions. These are meant merely to help investors get a handle on some historical perspective.
Now for the Brighter Side
Columns E, F and G in Figure 1 above displayed how much the S&P 500 rallied in the 1, 3 and 5-year periods following each previous bear market bottom. So, let’s do one more round of “What If”, as follows:
What will happen to the S&P 500 Index going forward if the course of the current bear market follows each given previous bear market?
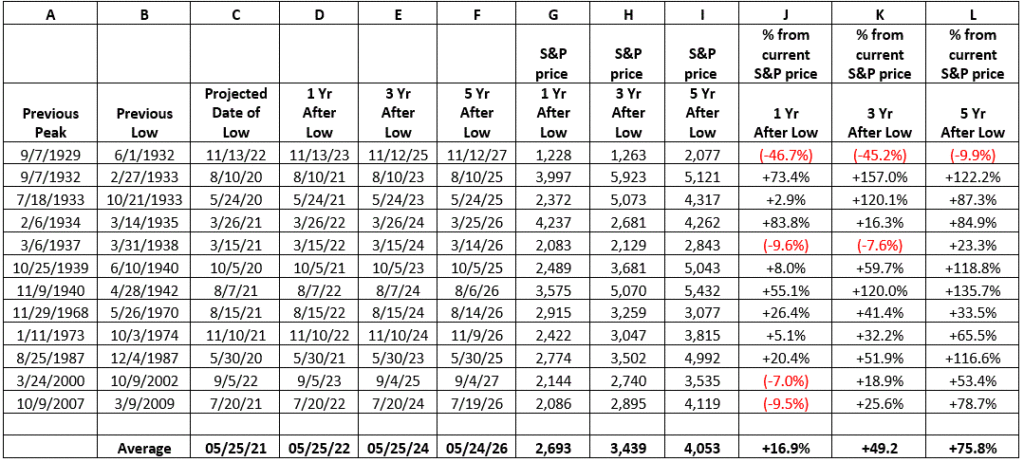
Each “projection” appears in Figure 3.
How to read Figure 3:
A and B listed the previous historical bear market
C listed the projected low date for the current bear market if it follows exactly the one in A and B
D, E, F listed the dates one, three and five years after projected low date
G, H and I listed the projected S&P 500 Index price level 1, 3, 5 years after projected low
Most importantly:
J displays the expected % price gain for the S&P 500 Index from the current level (2,305) as of the date listed in Column G (i.e., 1 year after the projected bear market low)
K displays the expected % price gain for the S&P 500 Index from the current level (2,305) as of the date listed in Column G (i.e., 3 years after the projected bear market low)
L displays the expected % price gain for the S&P 500 Index from the current level (2,305) as of the date listed in Column G (i.e., 5 years after the projected bear market low)

Figure 3 – Looking out across the abyss; projections going forward using previous bear markets as a template
So just to play this out, if the current bear market matches the “average” of all previous bear markets:
*The S&P 500 Index would bottom at 1,876 on 5/25/2021, -18.9% below the 3/20/2020 close
*By May 25th, 2022 the S&P 500 would be at 2,693, +17% above the 3/20/2020 close
*By May 25th, 2024 the S&P 500 would be at 3,439, +49% above the 3/20/2020 close
*By May 25th, 2026 the S&P 500 would be at 4,053, +76% above the 3/20/2020 close
For the record, if the current bear market matches the “Worst” of all previous bear markets:
*By November 13, 2022 the S&P 500 would be at 1,228, -47% the 3/20/2020 close
*By November 13, 1924 the S&P 500 would be at 1,263, -45% above the 3/20/2020 close
*By November 13, 1926 the S&P 500 would be at 2,077, -10% above the 3/20/2020 close
For the record, if the current bear market matches the “Best” of all previous bear markets:
*By August 7, 2022 the S&P 500 would be at 3,575, +55% above the 3/20/2020 close
*By August 7, 2024 the S&P 500 would be at 5,070, +120% above 3/20/2020 close
*By August 7, 2026 the S&P 500 would be at 5,432, +136% the 3/20/2020 close
Summary
Nobody knows what happens from here. If you want to go entirely “gloom and doom”, then the 1929-1932 experience argues that:
*There is a great deal of downside risk remaining
*Roughly seven and a half years from now the market will be about where it is now
If you are an optimist:
*We are at or near a bottom now
*By August of 2024, the S&P 500 Index will be 120% than it is right now
It is easy to give in to a “worst case scenario” mindset in this period of unprecedented uncertainty. And the idea of “playing defense” in the financial markets is not a bad one.
But as I said before, no one knows how this will all actually play out. And it is important to be mindful that one day – maybe relatively soon(?) – this crisis will peak. When that day comes there will A LOT of people ready to get back to living life AND with a much more purposeful – and possibly – much more grateful attitude.
Here’s hoping for the latter.
Jay Kaeppel
Disclaimer: The information, opinions and ideas expressed herein are for informational and educational purposes only and are based on research conducted and presented solely by the author. The information presented does not represent the views of the author only and does not constitute a complete description of any investment service. In addition, nothing presented herein should be construed as investment advice, as an advertisement or offering of investment advisory services, or as an offer to sell or a solicitation to buy any security. The data presented herein were obtained from various third-party sources. While the data is believed to be reliable, no representation is made as to, and no responsibility, warranty or liability is accepted for the accuracy or completeness of such information. International investments are subject to additional risks such as currency fluctuations, political instability and the potential for illiquid markets. Past performance is no guarantee of future results. There is risk of loss in all trading. Back tested performance does not represent actual performance and should not be interpreted as an indication of such performance. Also, back tested performance results have certain inherent limitations and differs from actual performance because it is achieved with the benefit of hindsight.


This was a really wonderful article. Many thanks for providing this information.