In this article I wrote about something I referred to as the “September Barometer” applied to Fidelity Select sector funds. In this piece we will apply the same principle to single country funds.
The Test
*For non domestic U.S. stock indexes the International Power Zone (IPZ) extends from November 1st through April 30th.
*I used ONLY a list of the original 17 iShares single country ETFs that started trading in 1996 (many other single country ETFs have been opened since then, but they are NOT included in this test – only the original 17).
*Using total monthly return data from the PEP database from Callan Associates, I ranked the single country ETF performance ONLY during the month of September.
*Whichever ETF performed best during the month of September was bought on the last trading day of October and sold six months later at the close on the last trading day of April the following year.
The Results
*Figure 1 displays the annual “International Power Zone” results for the selected fund versus simply buying and holding the broader international MSCI EAFE Index during the same seven-month period each year (i.e., returns for May through October are excluded).
| Year ending | Ticker | Ticker % +(-) | EAFE % +(-) | Difference |
| 1997 | EWI | 9.8 | 1.6 | 8.2 |
| 1998 | EWI | 46.6 | 15.4 | 31.1 |
| 1999 | EWM | 119.2 | 15.3 | 103.9 |
| 2000 | EWJ | 3.3 | 6.7 | (3.4) |
| 2001 | EWP | 4.3 | (8.0) | 12.3 |
| 2002 | EWL | 11.1 | 5.5 | 5.5 |
| 2003 | EWJ | (7.2) | 1.8 | (9.0) |
| 2004 | EWK | 16.5 | 12.4 | 4.1 |
| 2005 | EWD | 10.8 | 8.7 | 2.1 |
| 2006 | EWW | 28.4 | 22.9 | 5.5 |
| 2007 | EWP | 13.6 | 15.5 | (1.9) |
| 2008 | EWH | (15.5) | (9.2) | (6.3) |
| 2009 | EWM | 18.1 | (2.6) | 20.8 |
| 2010 | EWA | 8.3 | 2.5 | 5.8 |
| 2011 | EWD | 23.0 | 12.7 | 10.3 |
| 2012 | EWJ | 3.4 | 2.4 | 1.0 |
| 2013 | EWH | 10.3 | 16.9 | (6.6) |
| 2014 | EWP | 12.4 | 4.4 | 8.0 |
| 2015 | EWJ | 12.7 | 6.8 | 5.9 |
| 2016 | EWH | (2.2) | (3.1) | 0.8 |
| 2017 | EWO | 20.0 | 11.5 | 8.6 |
| 2018 | EWG | (0.6) | 3.4 | (4.0) |
| 2019 | EWD | 2.7 | 4.5 | (1.8) |
Figure 1 – September Barometer ETF performance versus EAFE Index – Nov. through April; 1996-2019
Figure 2 displays the cumulative equity curve for both the September Barometer and the EAFE Index during the International Power Zone months starting in 1996.
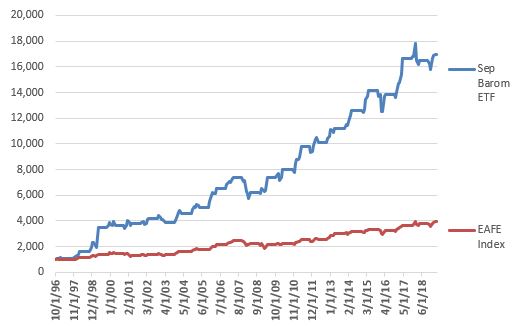
Figure 2 – September Barometer ETF performance versus EAFE Index – Nov. through April; 1996-2019
Things to Note:
*Since 1996 the September Barometer ETF has significantly outperformed the EAFE during the Power Zone months of November through April
*Both the September Barometer ETF and the EAFE Index showed a gain in 19 of the past 23 International Power Zone periods
*The median September Barometer ETF 7-month gain was +12.4% and the median 7-month loss was -4.7%
*The median EAFE Index 7-month gain was +6.8% and the median 7-month loss was -5.5%
*The September Barometer ETF outperformed the EAFE Index during the International Power Zone in 16 of the past 23 years, or 70% of the time
*If we look at 5-year rolling returns, the September Barometer ETF outperformed the EAFE Index in 18 out of 19 completed 5-year periods.
Summary
Does the month of September really “foretell” anything? And is the idea presented here actually a viable approach to investing?
Repeating now: Hey, this blog just thinks up the stuff. You take it from there.
Jay Kaeppel
Disclaimer: The data presented herein were obtained from various third-party sources. While I believe the data to be reliable, no representation is made as to, and no responsibility, warranty or liability is accepted for the accuracy or completeness of such information. The information, opinions and ideas expressed herein are for informational and educational purposes only and do not constitute and should not be construed as investment advice, an advertisement or offering of investment advisory services, or an offer to sell or a solicitation to buy any security.

