Most investors are at least vaguely familiar with the “January Barometer”, first presented by Yale Hirsch, the founder of The Stock Trader’s Almanac, in the early 1970’s. The gist of the January Barometer can be summed up in the phrase “As January goes, so goes the rest of the year.”
The September Barometer – such as it is – is a little different. It can be summed up in the following jumble of words: “The top performing Fidelity Select Sector fund during the month of September will tend to perform exceptionally well during the following Power Zone period of November through May.”
Note: I refer to the months of November through May as the “Power Zone” for U.S. stocks (“Power Zone” sounds sexier than “November through May”, no?)
The Test
For the record I arbitrarily excluded two commodity-based funds – Select Gold (FSAGX) and Natural Gas (FSNGX).
*Using total monthly return data from the PEP database from Callan Associates, I ranked the rest of the Fidelity sector funds every year for performance only during the month of September.
*Whichever fund performed best during the month of September was bought on the last trading day of October and sold seven months later at the close on the last trading day of May the following year.
The Results
*Figure 1 displays the annual “Power Zone” results for the selected fund versus simply buying and holding the S&P 500 during the same seven-month period each year (i.e., returns for June through October are excluded).
| Year ending | Ticker | Ticker %
+(-) |
SPX %
+(-) |
Difference |
| 1982 | FSPHX | 3.8 | (4.6) | 8.4 |
| 1983 | FIDSX | 33.0 | 24.1 | 8.9 |
| 1984 | FSUTX | (5.8) | (5.3) | (0.5) |
| 1985 | FSUTX | 23.9 | 17.1 | 6.9 |
| 1986 | FSCHX | 43.0 | 32.7 | 10.3 |
| 1987 | FSAIX | 19.7 | 21.0 | (1.3) |
| 1988 | FSCGX | 18.8 | 6.2 | 12.6 |
| 1989 | FDLSX | 26.4 | 17.4 | 9.0 |
| 1990 | FSLEX | 10.6 | 8.3 | 2.4 |
| 1991 | FSUTX | 8.8 | 30.8 | (22.0) |
| 1992 | FBMPX | 13.0 | 7.7 | 5.2 |
| 1993 | FSCSX | 29.3 | 9.4 | 19.9 |
| 1994 | FSHCX | 16.8 | (0.8) | 17.6 |
| 1995 | FSCSX | 20.1 | 14.8 | 5.3 |
| 1996 | FDFAX | 14.2 | 16.6 | (2.4) |
| 1997 | FSELX | 34.5 | 21.7 | 12.9 |
| 1998 | FSLBX | 28.0 | 20.3 | 7.7 |
| 1999 | FSESX | 10.6 | 19.4 | (8.8) |
| 2000 | FSCSX | 29.0 | 5.0 | 24.0 |
| 2001 | FSVLX | 13.9 | (11.5) | 25.4 |
| 2002 | FPHAX | (12.2) | 1.5 | (13.7) |
| 2003 | FSHCX | (12.0) | 9.9 | (21.9) |
| 2004 | FPHAX | 8.3 | 7.6 | 0.7 |
| 2005 | FSESX | 17.4 | 6.5 | 10.9 |
| 2006 | FNARX | 24.9 | 6.4 | 18.5 |
| 2007 | FSLBX | 13.5 | 12.3 | 1.2 |
| 2008 | FNARX | 14.0 | (8.5) | 22.5 |
| 2009 | FSRBX | (24.9) | (3.4) | (21.5) |
| 2010 | FNARX | (0.2) | 6.4 | (6.6) |
| 2011 | FSDCX | 18.7 | 14.9 | 3.8 |
| 2012 | FSUTX | 6.7 | 5.9 | 0.8 |
| 2013 | FSMEX | 20.1 | 17.0 | 3.1 |
| 2014 | FBIOX | 9.9 | 10.8 | (0.8) |
| 2015 | FPHAX | 18.4 | 5.7 | 12.8 |
| 2016 | FRESX | 7.4 | 2.1 | 5.3 |
| 2017 | FDCPX | 24.1 | 14.8 | 9.3 |
| 2018 | FSESX | 15.5 | 6.2 | 9.2 |
| 2019* | FSTCX | (1.7) | 5.6 | (7.3) |
Figure 1 – September Barometer fund performance versus S&P 500 Index – Nov. through May; 1982-2019
2019* – approximate through 5/14/2019
Figure 2 displays the cumulative equity curve for both the September Barometer and the S&P 500 Index during the Power Zone months starting in 1982.
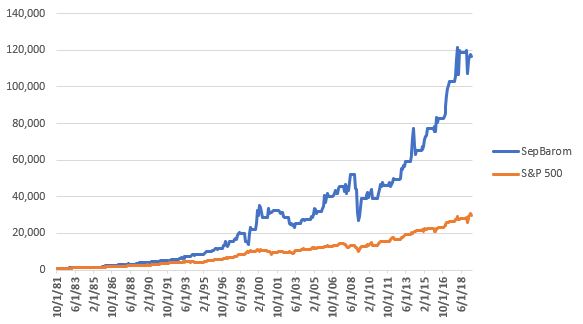 Figure 2 – September Barometer fund performance versus S&P 500 Index – Nov. through May; 1982-2019 (Growth of $1,000)
Two things jump out from the chart in Figure 2:
*Since 1981 the September Barometer has significantly outperformed the S&P 500 during the Power Zone months of November through May (+11,555% for the September Barometer versus +2,879% for the S&P 500 Index)
*Results are extremely volatile and not for the faint of heart
Other things to note:
*As of 5/14/19 the 2018-2019 September Barometer fund – ticker FSTCX – is down roughly -1.7% versus a gain of +5.6% for the S&P 500 Index since 10/31/2018
*Both the September Barometer fund and the S&P 500 Index showed a gain in 32 of the past 37 years (this assumes FSTCX ends May 2019 with a 7-month loss and the S&P 500 Index with a 7-month gain)
*Through May 2018 the average September Barometer fund 7-month gain was +14.4% versus +9.9% for the S&P 500 Index
*The “big disaster” for the September Barometer was Select Regional Banks (FSRBX) which was the top performer in September 2008 (with a loss of -1.92%). It then lost -51% in 4 months before ending with a 7-month loss of -24.9%. This suggests the potential for improvement with, a) a stop-loss of some sort, and/or, b) making no trade if the “best” performer showed a loss in September.
*The other “rough” years were the bear market years ending in 2002 and 2003. Again, this suggests that some sort of stop-loss or possibly a trend-following filter may add value.
*Probably the key statistic is that the September Barometer fund outperformed the S&P 500 Index during the Power Zone in 27 of the past 39 years (including 2018-2019 and assuming that FSTCX will end May underperforming SPX during the last seven months), or 69% of the time.
Summary
Does the month of September really “foretell” anything? And is the idea presented here actually a viable approach to investing?
Hey, this blog just thinks up the stuff. You take it from there.
Jay Kaeppel
Disclaimer: The data presented herein were obtained from various third-party sources. While I believe the data to be reliable, no representation is made as to, and no responsibility, warranty or liability is accepted for the accuracy or completeness of such information. The information, opinions and ideas expressed herein are for informational and educational purposes only and do not constitute and should not be construed as investment advice, an advertisement or offering of investment advisory services, or an offer to sell or a solicitation to buy any security.


Looks like Sept. is the new January! Thanks for the analysis.