Monthly Archives: November 2018

Combining Obscure Indicators to Find the Trend

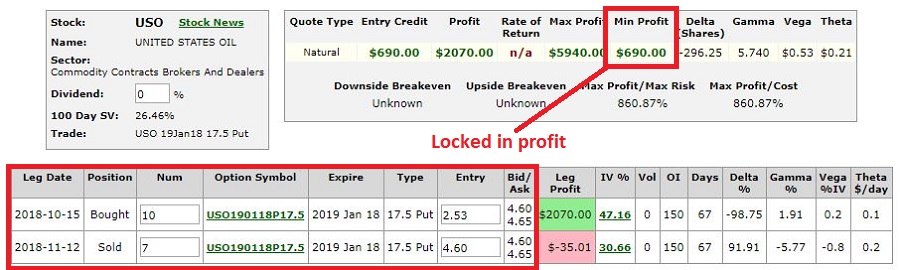
In this article I detailed an obscure but simple trend-following tool.  In this article I detailed an obscure but simple (except for all of the calculations – which I am pretty sure is why God invented software) oversold indicator.  So, it only seems logical that the next step would be to combine the two.

The Indicators

To review, there are two indicators:

MACD4010501: Which is basically just a 40-week exponential average minus a 105-week exponential average

VixRSI14: Which combines Larry Williams VixFix indicator with Welles Wilder’s RSI indicator

(Code for these indicators in AIQ Expert Design Studio appears at the end of the article)

The Caveat

What follows is NOT intended to be used to generate specific buy and/or sell signals.  The proper way to use it is to tell you when to consider playing the long side and when to consider selling short or simply standing aside.

The Rules

A “potentially bullish” situation exists when:

*Weekly MACD4010501 is trending higher

AND

*Weekly VixRSI14 is trending lower

AND

*Daily MACD4010501 is trending higher

A “potentially bearish” situation exists when:

*Weekly MACD4010501 is trending lower

AND

*Weekly VixRSI14 is trending higher

AND

*Daily MACD4010501 is trending lower

In a nutshell, we look for a bullish setup on the weekly chart (i.e., rising MACD4010501 and declining VixRSI4) and then look for a rising MACD4010501 on the daily chart

Bearish Example

In my previous article I used ticker WYNN, so let’s use the rules above to identify a time to play the long or short side.

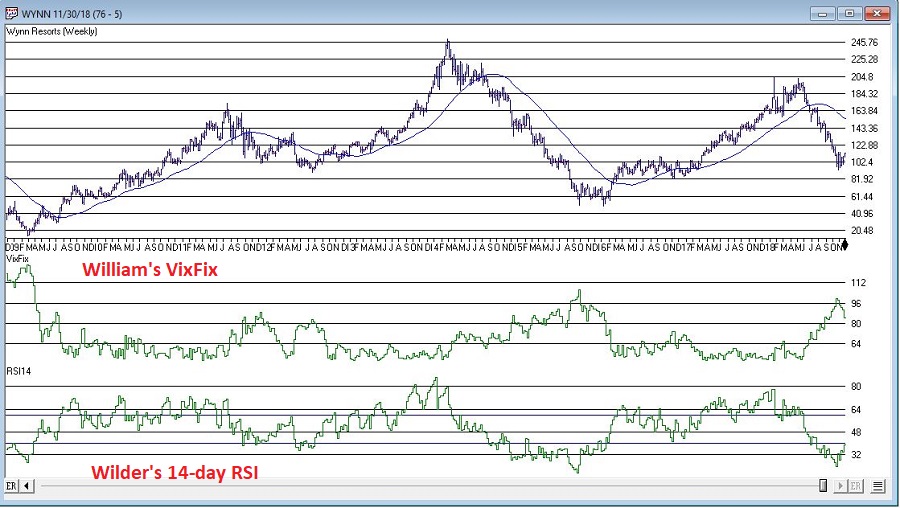
In Figure 1, we that on a weekly chart for WYNN MACD40501 turned down on 6/8/18 and VixRSI14 was trending higher.  This is a bearish “alert” (NOT an automatic sell signal!).

1
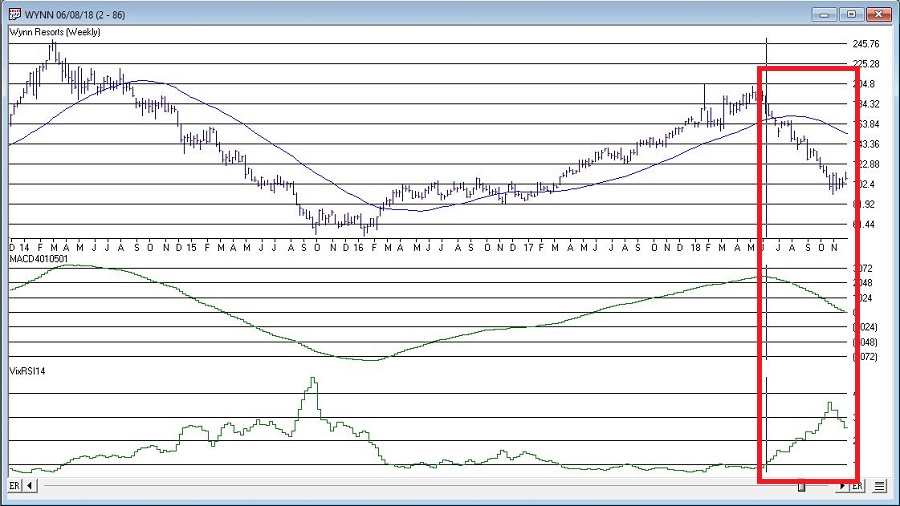
Figure 1 – Weekly WYNN; Bearish “Alert” in June 2018 (Courtesy AIQ TradingExpert)

In Figure 2 we go to the daily chart for WYNN.  After 6/8/18 the daily MACD4010501 indicator continues to trend lower until late October.  This tells us that we should either be playing the short side of WYNN or standing aside.

2
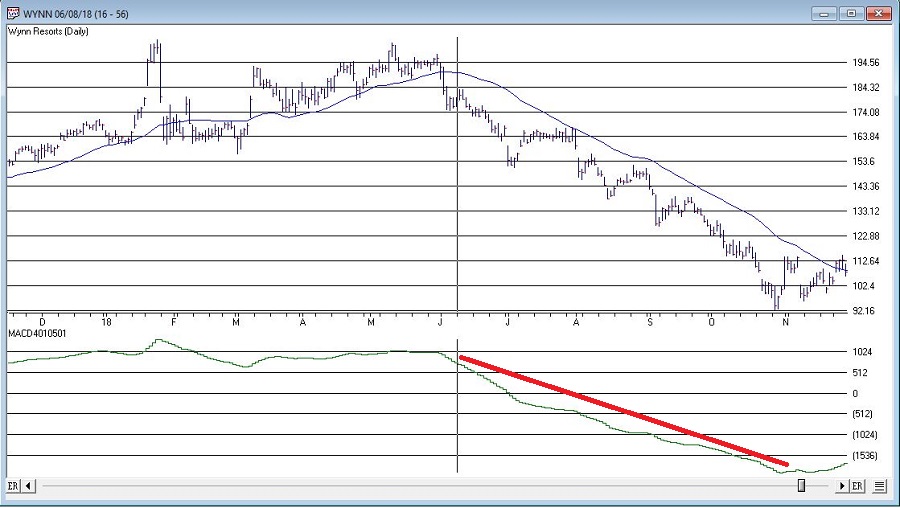
Figure 2 – Daily WYNN; daily trend indicator bearish after weekly “alert” (Courtesy AIQ TradingExpert)

One important thing to note:

*I am not suggesting that a trader should have sold short WYNN on 6/8/18 and held that short position until late October.  What I am suggesting is that active traders should be focusing on trying to make money from bearish positions (short stock, long puts, etc.) during this time

Bullish Example

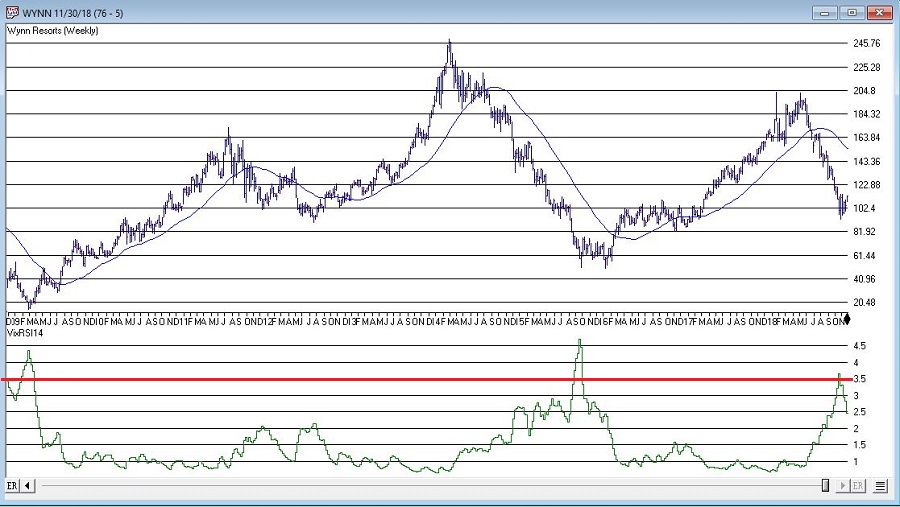
In Figure 3, we that on a weekly chart for WYNN MACD40501 was trending higher and VixRSI14 ticked lower on 1/6/17.  This is a bullish “alert” (NOT an automatic buy signal!).

3
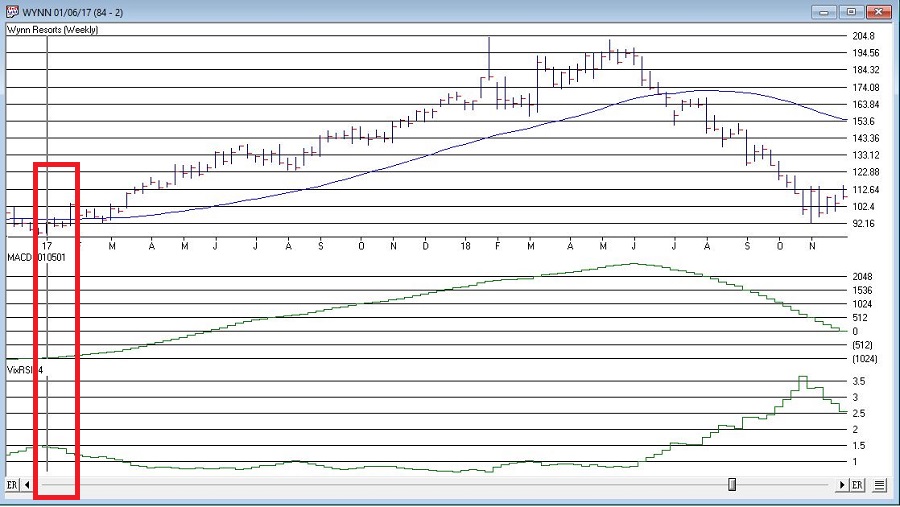
Figure 3 – Weekly WYNN; Bullish “Alert” (Courtesy AIQ TradingExpert)

In Figure 4 we go to the daily chart for WYNN.  After 1/6/17 the daily MACD4010501 indicator continues to trend higher until the end of June.  This tells us that we should either be playing the long side of WYNN or standing aside.

4
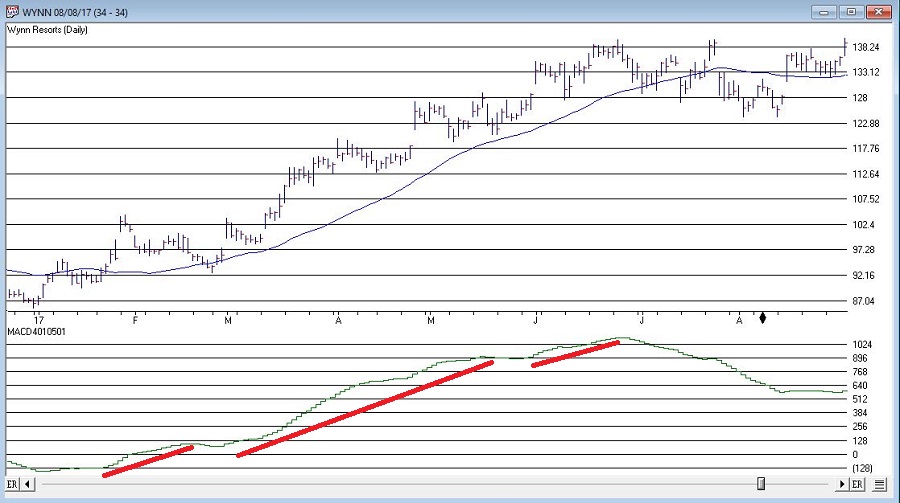
Figure 4 – Daily WYNN; daily trend indicator bullish after weekly “alert” (Courtesy AIQ TradingExpert)

Summary

Once again, please note that I am not advocating using the “rules” above as automated buy and sell signals.  Their purpose is simply to help a trader get in line with the dominant trend in price.

Typically, good trading is a function of putting the right pieces in place.  A trend identification method such as the above may serve as one piece.  Specific entry and exit criteria as well as good capital allocation and risk management methods must also be part of the equation.

Indicator Code

Below is the code for MACD4010501, VixFix, RSI14 and VixRSI14 from AIQ Expert Design Studio.

!#######################################

!MACD4010501 code

Define ss3 40.

Define L3 105.

ShortMACDMA3 is expavg([Close],ss3)*100.

LongMACDMA3 is expavg([Close],L3)*100.

MACD4010501 is ShortMACDMA3-LongMACDMA3.

!#######################################

!#######################################

!VixFix indicator code

hivalclose is hival([close],22).

vixfix is (((hivalclose-[low])/hivalclose)*100)+50.

!#######################################

!#######################################

!RSI14 code

Define days14 27.

U14 is [close]-val([close],1).

D14 is val([close],1)-[close].

AvgU14 is ExpAvg(iff(U14>0,U14,0),days14).

AvgD14 is ExpAvg(iff(D14>=0,D14,0),days14).

RSI14 is 100-(100/(1+(AvgU14/AvgD14))).

!#######################################

!#######################################

!VixRSI14 code

VixRSI14 is expavg(vixfix,3)/expavg(RSI14,3).

!#######################################

Jay Kaeppel

Disclaimer:  The data presented herein were obtained from various third-party sources.  While I believe the data to be reliable, no representation is made as to, and no responsibility, warranty or liability is accepted for the accuracy or completeness of such information.  The information, opinions and ideas expressed herein are for informational and educational purposes only and do not constitute and should not be construed as investment advice, an advertisement or offering of investment advisory services, or an offer to sell or a solicitation to buy any security.

An Obscure but Potentially Useful Oversold Indicator

Trend-following is essentially a “tried and true’ approach to investing.  But overbought/oversold (i.e., attempting to buy low/sell high) – that’s where the “excitement” is.  Of course, when it comes to trading and investing, “excitement” can be highly overrated.  Nevertheless, in this piece I want to talk about a relatively obscure indicator that may be useful in identifying vastly oversold situations.

The VixRSI14 Indicator

Part of the reason this indicator is obscure is because I think I “invented” it – but only by mashing together an indicator from Larry Williams and an indicator from Welles Wilder.  The first part is the standard Welles Wilder 14-day Relative Strength Index, more commonly referred to as “RSI”.

The 2nd part of VixRSI14 is an indicator created by famed trader Larry Williams which he dubbed “VixFix”.  This indicator is an effort to create a “Vix Index-like” indicator for any security.

AIQ TradingExpert code for these indicators appears at the end of the article.

A Few Notes

*For the record, VixRSI14 is calculated by taking a 3-day exponential average of VixFix and dividing that by a 3-day exponential average of RSI14 (are we having fun yet?).  Please see code at the end of the article.

*I prefer to use VixRSI14 using weekly data rather than daily data

*(Unfortunately) There are no “magic numbers” that indicate that a completely risk-free, you can’t lose, just buy now and watch the money roll in” buying opportunity is at hand (Disclaimer: If there was, I would probably just keep it to myself and not bother writing the article – sorry, it’s just my nature).  That being said, a decent “rule of thumb” is to look for a reading above 3.5 followed by a downside reversal.

(Click any chart below to enlarge)

With those thoughts in mind, Figure 1 displays a weekly chart of Wynn Resorts (WYNN) with the two indicators plotted separately below the bar chart.1Figure 1 – WYNN with William’s VixFix and Wilder’s RSI 14-day (Courtesy AIQ TradingExpert)

Note that as price declines, VixFix tends to rise and RSI14 tends to fall.  VIXRSI14 essentially identifies “extremes” in the difference between these two.  Figure 2 displays WYNN with VixRSI14 plotted below the bar chart.

2Figure 2 – WYNN with VixRSI14 (Courtesy AIQ TradingExpert)

More “examples” appear in Figures 3 through 8 below.

3Figure 3 – AMD (Courtesy AIQ TradingExpert)

4Figure 4 – BAC (Courtesy AIQ TradingExpert)

5Figure 5 – DISH (Courtesy AIQ TradingExpert)

6Figure 6 – GRMN (Courtesy AIQ TradingExpert)

7Figure 7 – NTAP (Courtesy AIQ TradingExpert)

8Figure 8 – YHOO (Courtesy AIQ TradingExpert)

Summary

As always, I merely present “ideas” here at JOTM.  So, do not assume from the charts above that you have found the “keys to the kingdom”.  But if used in conjunction with other confirming indicators – and remembering to employ some sort of risk control for those instances when a stock price decline fails to arrest itself even after VixRSI4 peaks above 3.5 – VixRSI14 may hold some value.

Indicator Code

Below is the code for VixFix, RSI14 and VixRSI14 from AIQ Expert Design Studio.

!#######################################

!VixFix indicator code

hivalclose is hival([close],22).

vixfix is (((hivalclose-[low])/hivalclose)*100)+50.

!#######################################


!#######################################

!RSI14 code

Define days14 27.

U14 is [close]-val([close],1).

D14 is val([close],1)-[close].

AvgU14 is ExpAvg(iff(U14>0,U14,0),days14).

AvgD14 is ExpAvg(iff(D14>=0,D14,0),days14).

RSI14 is 100-(100/(1+(AvgU14/AvgD14))).

!#######################################

!#######################################

!VixRSI14 code

VixRSI14 is expavg(vixfix,3)/expavg(RSI14,3).

!#######################################

Jay Kaeppel

Disclaimer:  The data presented herein were obtained from various third-party sources.  While I believe the data to be reliable, no representation is made as to, and no responsibility, warranty or liability is accepted for the accuracy or completeness of such information.  The information, opinions and ideas expressed herein are for informational and educational purposes only and do not constitute and should not be construed as investment advice, an advertisement or offering of investment advisory services, or an offer to sell or a solicitation to buy any security.

An Obscure But Useful Trend-Following Tool

Everyone has heard about trend-following.  And most traders have at least a foggy grasp of the relative pros and cons associated with trend following.  And anyone who has ever employed any type of trend-following technique is aware that they are great when there is an actual trend, but that whipsaws are inevitable.

What I am about to show you will not change these facts.  But today’s piece is just a “quickie” to highlight an obscure way to use a common indicator as a “confirmation/ denial” check when assessing the trend of a given security.  For the record, I am making no claim that this indicator generates profitably “trading signals in and of itself.  Its one of those things that – and I hate this phrase as much as you do but – should be used in conjunction with other indicators to get a good sense of the current “state of the trend” for a given security.

Nothing more, nothing less.

MACD Stretched Long

Most traders are familiar with the MACD indicator.  Originally popularized by Gerald Appel, it uses a set of moving averages to attempt to assess the trend in price (and many traders also use it to try to identify overbought or oversold situations).  Standard parameters are 9,26 and 12.  The version I use is different in several ways:

*Whereas the standard MACD generates two lines and a histogram can be drawn of the difference between the two, this version just generates one line – we will call in the trend line (catchy, no?)

*We will use parameters of 40 and 105

*One other note is that (at least according to me) this indicator is best used with weekly data.

The MACD4010501

Here is the formula for AIQ TradingExpert Expert Design Studio:

Define ss3 40.

Define L3 105.

ShortMACDMA3 is expavg([Close],ss3)*100.

LongMACDMA3 is expavg([Close],L3)*100.

MACD4010501Value is ShortMACDMA3-LongMACDMA3.

As I said this should be used with “other” indicators.  For example, one might consider the current price versus a 40-week moving average.

Standard Interpretation:

*If price is above the 40-week moving average (or if whatever other trend-following indicator you are using is bullish), AND

*The MACD4010501 is trend higher THEN

ONLY play the long side of that security

Likewise:

*If price is below the 40-week moving average (or if whatever other trend-following indicator you are using is bearish), AND

*The MACD4010501 is trend lower THEN

ONLY play the short side of that security (or at least DO NOT play the long side)

Finally, DO NOT assume that every change of trend in MACD4010501 is some sort of buy or sell signal.  Consider it only as a filter for your trades.

Some random examples appear in Figures 1 through 4 (click to enlarge any chart)

1Figure 1 – AMZN (Courtesy AIQ TradingExpert)

2Figure 2 – IBM (Courtesy AIQ TradingExpert)

3Figure 3 – WMT (Courtesy AIQ TradingExpert)

4Figure 4 – TLT (Courtesy AIQ TradingExpert)

Summary

To repeat, the proper use of this obscure version of the popular MACD indicator is as follows:

*Consider the trend of MACD4010501

*Consider one or more other trend-following indicators

*If there is bullish agreement, then apply your own shorter-term entry and exit techniques to trade the long side.

*If there is bearish agreement, then apply your own shorter-term entry and exit techniques to trade the short side (or simply stand aside).

Trade on!

Jay Kaeppel

Disclaimer:  The data presented herein were obtained from various third-party sources.  While I believe the data to be reliable, no representation is made as to, and no responsibility, warranty or liability is accepted for the accuracy or completeness of such information.  The information, opinions and ideas expressed herein are for informational and educational purposes only and do not constitute and should not be construed as investment advice, an advertisement or offering of investment advisory services, or an offer to sell or a solicitation to buy any security.

Holiday Cheer to the Rescue?

From a trend-following perspective the stock market appears to be teetering on the brink.  To get a sense of this see Figure 1 which displays the Dow, the Nasdaq 100, the S&P 500 and the Russell 2000 clockwise from upper left, along with their respective 200-day moving averages.  The indexes are tipping below the moving averages and the moving averages are starting to rollover.

1Figure 1 – Major Market Indexes foundering? (Courtesy AIQ TradingExpert)

Going forward, it’s going to be what it’s going to be, but there may be some reason for optimism between the end of this week and the end of the year.

The Favorable Holiday Period

Different analysts may reasonably use different configurations, but for my purposes the “Favorable Holiday Period” extends from:

*The close on the Friday before Thanksgiving (Friday, November 16)

*Through the close on the last trading day of the year (Monday, December 31).

Figure 2 displays the growth of $1,000 invested in the Dow Jones Industrials Average ONLY during this period each year starting in 1942.

2

Figure 2 – Growth of $1,000 investedin Dow Industrials ONLY during Favorable Holiday Period (1942-Present)

Figure 3 displays some relevant facts and figures.

3

Figure 3 – Facts and Figures for Favorable Holiday Period (1942-2017)

Figure 4 at the end of the articles displays year-by-years.

Summary

So, what’s going to happen to the stock market between now and the end of the year?  I have to go with my standard answer of, “it beats me.”  It is important for investors to “pay defense” and preserve capital when the overall market starts to break down.  Still, at the moment there a Battle Royale playing out between the “potentially unfavorable price trends” and the “way oversold in October plus favor seasonal trends combined” forces.

Do not hesitate to play defense of things go south.  Still, history suggests that investors who can ignore the current volatility (not to mention all the blaring headlines) may come out of this thing OK.

Cheers(?)

Year Holiday Period % +(-)
1942 3.5
1943 2.2
1944 4.3
1945 0.3
1946 7.3
1947 (0.6)
1948 (0.1)
1949 3.4
1950 1.6
1951 3.2
1952 4.4
1953 1.8
1954 7.0
1955 1.1
1956 3.9
1957 (0.9)
1958 3.1
1959 5.3
1960 2.0
1961 0.2
1962 3.3
1963 2.8
1964 (1.9)
1965 1.7
1966 (2.9)
1967 5.0
1968 (2.2)
1969 (3.7)
1970 10.2
1971 9.8
1972 1.4
1973 (1.4)
1974 1.3
1975 1.1
1976 5.9
1977 (0.5)
1978 0.9
1979 2.8
1980 (3.6)
1981 2.6
1982 2.5
1983 0.6
1984 2.0
1985 5.8
1986 1.9
1987 1.3
1988 5.1
1989 3.8
1990 3.3
1991 8.1
1992 2.3
1993 1.6
1994 0.5
1995 2.5
1996 0.5
1997 1.0
1998 0.2
1999 4.5
2000 1.5
2001 1.6
2002 (5.7)
2003 8.7
2004 3.1
2005 (0.5)
2006 1.0
2007 0.7
2008 16.2
2009 1.1
2010 3.3
2011 3.6
2012 4.1
2013 3.5
2014 0.6
2015 (2.2)
2016 5.9
2017 5.8


Figure 4 – Favorable Holiday Period % +(-) Year-by-Year


Jay Kaeppel


Disclaimer:  The data presented herein were obtained from various third-party sources.  While I believe the data to be reliable, no representation is made as to, and no responsibility, warranty or liability is accepted for the accuracy or completeness of such information.  The information, opinions and ideas expressed herein are for informational and educational purposes only and do not constitute and should not be construed as investment advice, an advertisement or offering of investment advisory services, or an offer to sell or a solicitation to buy any security.

The Agony and Ecstasy of Locking a Profit

In this article I highlighted a hypothetical seasonal play in crude oil.  As you can see in Figures 1 and 2 – so far so good.  The crude oil market sold off almost exactly in line with its seasonal tendency to be weak during this time of year (just don’t go thinking that it is an automatic thing every year).1Figure 1 – Crude Oil following annual seasonal trend (Courtesy Sentimentrader.com)

Now the example trade I highlighted in the original article has:

*A very nice open profit

*The potential to give it all back and more if crude rebounds

2Figure 2 – USO example trade with an open profit (Courtesy www.OptionsAnalysis.com)

One great thing about options is the ability to “adjust” a trade as situations change.  In this example, it is not so much an “adjustment” per se, but rather more like “taking a lot of chips off the table.”

So here goes:

*Sell 7 Jan2019 USO 17.5 puts

This leaves us with 3 Jan2019 USO puts as shown in Figures 3 and 4.  The good news is that we still have more profit potential if USO continue to decline AND we have now locked in a minimum profit of +$690.3Figure 3 – Adjusted USO trade details (Courtesy www.OptionsAnalysis.com)

4Figure 4 – Adjusted USO trade risk curves (Courtesy www.OptionsAnalysis.com)

The Bad News

The one “quirk” is that – as you can see in Figure 5, which overlays the original position with the adjusted position – if USO does continue to decline the adjusted position will make a lot less money than the original position.5Figure 5 – The “Original” USO trade versus the “Adjusted” USO trade (Courtesy www.OptionsAnalysis.com)

The Choice

So, the question comes down to:

*Do you want to lock in a profit and let the rest ride (albeit with less potential)?

*Or, do you want to play for the maximum profit?

As always, there is no “correct” answer.  The key is to make your choice based on your best thinking at the moment – then let the chips fall where they may and NEVER look back in anger or regret.

Jay Kaeppel

Disclaimer:  The data presented herein were obtained from various third-party sources.  While I believe the data to be reliable, no representation is made as to, and no responsibility, warranty or liability is accepted for the accuracy or completeness of such information.  The information, opinions and ideas expressed herein are for informational and educational purposes only and do not constitute and should not be construed as investment advice, an advertisement or offering of investment advisory services, or an offer to sell or a solicitation to buy any security.

How to Avoid Losing 94% in Energy Service Stocks

Well, that’s a catchy title, no?  Of course, please note that the title does NOT read, “How to Make Incredible Sums of Money in Energy Services.”  This is an important distinction because making money in energy stocks has been a pretty tough thing to do since about 2008.  Still, avoiding 94% losses is probably a good thing to know how to do.  So, let’s proceed, shall we?

The Proxy for Energy Service Stocks

For our purposes we will use Fidelity Select Energy Services fund (ticker FSESX).

You will probably think I am kidding at first but, the way to avoid losing 94% in oil service stocks is simply to avoid investing in FSESX (or any security highly correlated to it) during the months of June through November.

That’s it.  Why, you might ask?  Simple.  Figure 1 displays the growth (Jay, that word “growth”, I do not think it means what you think it means) of $1,000 invested in FSESX ONLY during the months of June through November every year starting in 1986.

1

Figure 1 – Growth of $1,000 invested in ticker FSESX June through November; 12/31/1985-10/31/2018 (Source: PEP database from Callan Associates)

It’s not pretty.  And it is a great thing to avoid.  But here comes the not so great part.  Figure 2 displays the growth of $1,000 invested in FSESX:

*Only during the months of December through May

*On a buy-and-hold basis

2

Figure 2 – Growth of $1,000 invested in ticker FSESX December through May (blue) versus on a buy-and-hold basis (red); 12/31/1985-10/31/2018 (Source: PEP database from Callan Associates)

As I intimated earlier, even avoiding the “Bad Months” has not resulted in much in the way of capital appreciation in the last decade.  But please remember the point of this article is essentially as follows: if you invest in Energy Service stocks between the end of May and the end of November and you expect to make money, you may be, um, disappointed.  Or at least, that is what history strongly seems to suggest.

For the record:

*$1,000 invested on a buy-and-hold basis grew to $6,800

*$1,000 invested only December through May each year grew to $106,300

*$1,000 invested only June through November declined to $64 (i.e., -94%)

Summary

If you want to know how to make 94% in energy service stocks you will unfortunately have to find another article.  But for now, at least we know how to avoid losing 94%.

Hey, it’s a step in the right direction.

Jay Kaeppel

Disclaimer:  The data presented herein were obtained from various third-party sources.  While I believe the data to be reliable, no representation is made as to, and no responsibility, warranty or liability is accepted for the accuracy or completeness of such information.  The information, opinions and ideas expressed herein are for informational and educational purposes only and do not constitute and should not be construed as investment advice, an advertisement or offering of investment advisory services, or an offer to sell or a solicitation to buy any security.

Good Days to Seek Health Care (Stocks)

This is a follow up to this previous article.  It’s never a good day to be sick, but as it turns out there are days that are better than others for seeking health care, well, health care stocks at least.

The “Strategy”

Buy and hold ticker HCPIX (Profunds Healthcare fund – which tracks the Dow Jones U.S. Health Care Index leveraged 1.5-to-1) on the following days:

*Trading days #9, 10, 11 and 12 each month

*The last 4 trading days of the month and the first 2 trading days of the next month

Continue to make these trades each and every month until, um, well, until you no longer have a need for health care, if you get my drift.

The Results

Figure 1 displays the growth of $1,000 invested in HCPIX using the Strategy rules listed above.

1

Figure 1 – Growth of $1,000 invested in HCPIX using Jay’s Strategy; 6/19/00-11/2/18

Figure 2 displays the growth of $1,000 invested in HCPIX during all other trading days.

2

Figure 2 – Growth of $1,000 invested in HCPIX during all other trading days; 6/19/00-11/2/18

The results in Figure 2 are enough to make you sick.  Fortunately, the cure appears in Figure 1.

For the record, from 6/19/2000 through 11/2/2018:

*$1,000 invested during Good Days grew to $31,197 (+3,020%)

*$1,000 invested during Bad Days shrank to $112 (-89%)

Figure 3 displays year-by-year result through 11/2/2018.

3

Figure 3 – Year-by-Year results; 6/19/00-11/2/18

*The Good Days gained an annual average of +20.8%

*The Bad Days lost an annual average of -8.4%

Summary

I hope this helps you feel better.

Jay Kaeppel

Disclaimer:  The data presented herein were obtained from various third-party sources.  While I believe the data to be reliable, no representation is made as to, and no responsibility, warranty or liability is accepted for the accuracy or completeness of such information.  The information, opinions and ideas expressed herein are for informational and educational purposes only and do not constitute and should not be construed as investment advice, an advertisement or offering of investment advisory services, or an offer to sell or a solicitation to buy any security.

The CISS Large-Cap/Small-Cap Strategy

Everyone is familiar with the KISS acronym, which – as everyone knows, stands for “Keep It Simple Stupid”.  Far fewer people are familiar the CISS acronym, which stands for “Clearly Insanely Stupidly Simple”.  Which is what the “system” that follows qualifies as.  The good news is that beyond being simple it has also been pretty darned effective over time.

The Large-Cap/Small-Cap Debate

If you search the web for info on large-cap stocks versus small-cap stocks you will come up with roughly 537 million possible results.  It is quite likely that somewhere in there you will find a more effective method than that which follows.  Still, that’s a lot of links to search through.  So may try this out first.

Jay’s CISS Large-Cap/Small-Cap “System”

Here are the rules:

*If the S&P 500 Index outperforms the Russell 2000 Index for the year, then buy and hold the S&P 500 Index during the following year.

*If the Russell 2000 Index outperforms the S&P 500 Index Index for the year, then buy and hold the Russell 2000 Index during the following year.

Did I mention it was simple?

The Results

To measure results I am using monthly total return data for the S&P 500 Index and the Russell 2000 Index.  We will look at performance for

*The System (as described above)

*The Opposite of the System (i.e., holding the worse performer from the pervious year)

*Splitting capital between S&P 500 and Russell 200 and rebalancing Jan.1 each year

Figure 1 displays the growth of $1,000 for each of the above starting on 12/31/1979.1b

Figure 1 – Jay’s System versus Buy-and-Hold and the “Opposite” of the System; 12/31/1979-10/31/2018

For the record:

*The “System” gained +10,361%

*Splitting money between SPX and RUT on Jan 1 each year gained +6,272%

*Doing the “opposite” of the System gained +3,471%

Because this “System” is always fully invested in either the S&P 500 Index or the Russell 2000 Index, it takes its lumps in bear markets.  So in 2008, for instance, it took a beating just like everything else.  But that is the nature of “always fully invested in stocks” methods.

The key point is that in the end the CISS System made 1.65 times as much as “buy-and-hold” and 2.98 times as much as doing the “opposite of the System”.

Figure 2 displays the Year-by-Year results:

Column A = Year

Column B = SPX total annual return

Column C = RUT total annual return

Column D = Which index is held during that calendar year

Column E = Annual % gain(loss) for The System for that calendar year

Column F = Annual % gain(loss) from holding the “other” index

Column G = % gain(loss) from splitting $ evenly between SPX and RUT on January 1st

Column H = $1,000 using System becomes

Column I = $1,000 using the “Opposite” of the System becomes

Column J = $1,000 using Buy-and-Hold (and annual rebalance) becomes

A B C D E F G H I J
Year SPX RUT Hold System Opposite Split System Opposite Split
1979 18.6 43.1 $1000 $1000 $1000
1980 32.5 38.6 RUT 38.6 32.5 35.5 1,386 1,325 1,355
1981 (4.9) 2.0 RUT 2.0 (4.9) (1.4) 1,414 1,260 1,336
1982 21.5 24.9 RUT 24.9 21.5 23.2 1,767 1,531 1,646
1983 22.6 29.1 RUT 29.1 22.6 25.8 2,282 1,877 2,072
1984 6.3 (7.3) RUT (7.3) 6.3 (0.5) 2,115 1,994 2,061
1985 31.7 31.0 SPX 31.7 31.0 31.4 2,786 2,613 2,708
1986 18.7 5.7 SPX 18.7 5.7 12.2 3,306 2,762 3,038
1987 5.3 (8.8) SPX 5.3 (8.8) (1.8) 3,480 2,519 2,984
1988 16.6 25.0 SPX 16.6 25.0 20.8 4,058 3,149 3,605
1989 31.7 16.3 RUT 16.3 31.7 24.0 4,717 4,147 4,469
1990 (3.1) (19.5) SPX (3.1) (19.5) (11.3) 4,571 3,339 3,965
1991 30.5 46.0 SPX 30.5 46.0 38.3 5,964 4,877 5,481
1992 7.6 18.4 RUT 18.4 7.6 13.0 7,062 5,248 6,195
1993 10.1 18.9 RUT 18.9 10.1 14.5 8,395 5,777 7,092
1994 1.3 (1.8) RUT (1.8) 1.3 (0.3) 8,242 5,853 7,074
1995 37.6 28.5 SPX 37.6 28.5 33.0 11,339 7,519 9,409
1996 23.0 16.5 SPX 23.0 16.5 19.7 13,942 8,759 11,265
1997 33.4 22.4 SPX 33.4 22.4 27.9 18,594 10,717 14,404
1998 28.6 (2.5) SPX 28.6 (2.5) 13.0 23,907 10,445 16,279
1999 21.0 21.3 SPX 21.0 21.3 21.2 28,938 12,665 19,722
2000 (9.1) (3.0) RUT (3.0) (9.1) (6.1) 28,064 11,512 18,526
2001 (11.9) 2.5 RUT 2.5 (11.9) (4.7) 28,762 10,143 17,656
2002 (22.1) (20.5) RUT (20.5) (22.1) (21.3) 22,870 7,902 13,897
2003 28.7 47.3 RUT 47.3 28.7 38.0 33,677 10,168 19,173
2004 10.9 18.3 RUT 18.3 10.9 14.6 39,850 11,275 21,973
2005 4.9 4.6 RUT 4.6 4.9 4.7 41,665 11,829 23,013
2006 15.8 18.4 SPX 15.8 18.4 17.1 48,246 14,001 26,944
2007 5.5 (1.6) RUT (1.6) 5.5 2.0 47,490 14,770 27,473
2008 (37.0) (33.8) SPX (37.0) (33.8) (35.4) 29,920 9,780 17,750
2009 26.5 27.2 RUT 27.2 26.5 26.8 38,050 12,368 22,510
2010 15.1 26.9 RUT 26.9 15.1 21.0 48,268 14,231 27,228
2011 2.1 (4.2) RUT (4.2) 2.1 (1.0) 46,252 14,531 26,947
2012 16.0 16.3 SPX 16.0 16.3 16.2 53,654 16,907 31,306
2013 32.4 38.8 RUT 38.8 32.4 35.6 74,484 22,383 42,452
2014 13.7 4.9 RUT 4.9 13.7 9.3 78,130 25,447 46,397
2015 1.4 (4.4) SPX 1.4 (4.4) (1.5) 79,211 24,324 45,694
2016 12.0 21.3 SPX 12.0 21.3 16.6 88,684 29,507 53,294
2017 21.8 14.6 RUT 14.6 21.8 18.2 101,674 35,949 63,015
2018 2.9 (0.7) SPX 2.9 (0.7) 2.9 104,613 35,712 64,836

Figure 2 – Year-by-Year Results

Summary

So is this a great, world-beater “System.”  Probably not.  But it has managed to outperform buy-and-hold by a factor of 1.65-to-1 over the last 38 years.

And did I mention that it’s simple?

Jay Kaeppel

Disclaimer:  The data presented herein were obtained from various third-party sources.  While I believe the data to be reliable, no representation is made as to, and no responsibility, warranty or liability is accepted for the accuracy or completeness of such information.  The information, opinions and ideas expressed herein are for informational and educational purposes only and do not constitute and should not be construed as investment advice, an advertisement or offering of investment advisory services, or an offer to sell or a solicitation to buy any security.