From a trend-following perspective the stock market appears to be teetering on the brink. To get a sense of this see Figure 1 which displays the Dow, the Nasdaq 100, the S&P 500 and the Russell 2000 clockwise from upper left, along with their respective 200-day moving averages. The indexes are tipping below the moving averages and the moving averages are starting to rollover.
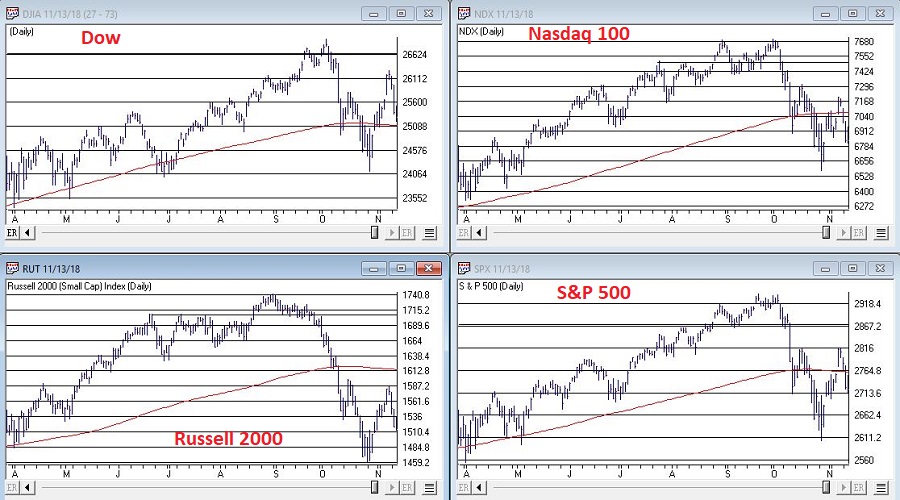 Figure 1 – Major Market Indexes foundering? (Courtesy AIQ TradingExpert)
Going forward, it’s going to be what it’s going to be, but there may be some reason for optimism between the end of this week and the end of the year.
The Favorable Holiday Period
Different analysts may reasonably use different configurations, but for my purposes the “Favorable Holiday Period” extends from:
*The close on the Friday before Thanksgiving (Friday, November 16)
*Through the close on the last trading day of the year (Monday, December 31).
Figure 2 displays the growth of $1,000 invested in the Dow Jones Industrials Average ONLY during this period each year starting in 1942.

Figure 2 – Growth of $1,000 investedin Dow Industrials ONLY during Favorable Holiday Period (1942-Present)
Figure 3 displays some relevant facts and figures.
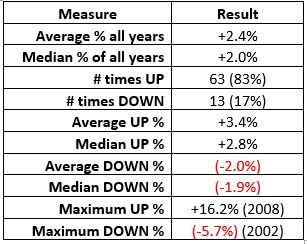
Figure 3 – Facts and Figures for Favorable Holiday Period (1942-2017)
Figure 4 at the end of the articles displays year-by-years.
Summary
So, what’s going to happen to the stock market between now and the end of the year? I have to go with my standard answer of, “it beats me.” It is important for investors to “pay defense” and preserve capital when the overall market starts to break down. Still, at the moment there a Battle Royale playing out between the “potentially unfavorable price trends” and the “way oversold in October plus favor seasonal trends combined” forces.
Do not hesitate to play defense of things go south. Still, history suggests that investors who can ignore the current volatility (not to mention all the blaring headlines) may come out of this thing OK.
Cheers(?)
| Year | Holiday Period % +(-) |
| 1942 | 3.5 |
| 1943 | 2.2 |
| 1944 | 4.3 |
| 1945 | 0.3 |
| 1946 | 7.3 |
| 1947 | (0.6) |
| 1948 | (0.1) |
| 1949 | 3.4 |
| 1950 | 1.6 |
| 1951 | 3.2 |
| 1952 | 4.4 |
| 1953 | 1.8 |
| 1954 | 7.0 |
| 1955 | 1.1 |
| 1956 | 3.9 |
| 1957 | (0.9) |
| 1958 | 3.1 |
| 1959 | 5.3 |
| 1960 | 2.0 |
| 1961 | 0.2 |
| 1962 | 3.3 |
| 1963 | 2.8 |
| 1964 | (1.9) |
| 1965 | 1.7 |
| 1966 | (2.9) |
| 1967 | 5.0 |
| 1968 | (2.2) |
| 1969 | (3.7) |
| 1970 | 10.2 |
| 1971 | 9.8 |
| 1972 | 1.4 |
| 1973 | (1.4) |
| 1974 | 1.3 |
| 1975 | 1.1 |
| 1976 | 5.9 |
| 1977 | (0.5) |
| 1978 | 0.9 |
| 1979 | 2.8 |
| 1980 | (3.6) |
| 1981 | 2.6 |
| 1982 | 2.5 |
| 1983 | 0.6 |
| 1984 | 2.0 |
| 1985 | 5.8 |
| 1986 | 1.9 |
| 1987 | 1.3 |
| 1988 | 5.1 |
| 1989 | 3.8 |
| 1990 | 3.3 |
| 1991 | 8.1 |
| 1992 | 2.3 |
| 1993 | 1.6 |
| 1994 | 0.5 |
| 1995 | 2.5 |
| 1996 | 0.5 |
| 1997 | 1.0 |
| 1998 | 0.2 |
| 1999 | 4.5 |
| 2000 | 1.5 |
| 2001 | 1.6 |
| 2002 | (5.7) |
| 2003 | 8.7 |
| 2004 | 3.1 |
| 2005 | (0.5) |
| 2006 | 1.0 |
| 2007 | 0.7 |
| 2008 | 16.2 |
| 2009 | 1.1 |
| 2010 | 3.3 |
| 2011 | 3.6 |
| 2012 | 4.1 |
| 2013 | 3.5 |
| 2014 | 0.6 |
| 2015 | (2.2) |
| 2016 | 5.9 |
| 2017 | 5.8 |
Figure 4 – Favorable Holiday Period % +(-) Year-by-Year
Jay Kaeppel
Disclaimer: The data presented herein were obtained from various third-party sources. While I believe the data to be reliable, no representation is made as to, and no responsibility, warranty or liability is accepted for the accuracy or completeness of such information. The information, opinions and ideas expressed herein are for informational and educational purposes only and do not constitute and should not be construed as investment advice, an advertisement or offering of investment advisory services, or an offer to sell or a solicitation to buy any security.

