As of January 1st, 2021, I will be joining www.Sentimentrader.com. I have long been a fan, a follower and a user of this top website. Founded by Jason Goepfert, I have long considered Sentimentrader to be the leader in quantitative market analysis. When I was offered the opportunity to join the team I jumped at the chance.
Needless to say, I encourage everyone
to consider subscribing and to take advantage of the wealth of information
contained on the site (that I have used for years) as well as the straightforward,
objective analysis that is offered on a daily basis.
I plan to bring a lot of previously
unreleased material with me and as much insight as I can muster on the topics
of trading systems/strategies, seasonality, options trading and on how to “think
like a trader.”
Wishing you all a Happy New Year!
Jay
Kaeppel
Disclaimer: The information, opinions and ideas expressed herein are for
informational and educational purposes only and are based on research conducted
and presented solely by the author. The
information presented represents the views of the author only and does not
constitute a complete description of any investment service. In addition, nothing presented herein should
be construed as investment advice, as an advertisement or offering of
investment advisory services, or as an offer to sell or a solicitation to buy
any security. The data presented herein
were obtained from various third-party sources.
While the data is believed to be reliable, no representation is made as
to, and no responsibility, warranty or liability is accepted for the accuracy
or completeness of such information.
International investments are subject to additional risks such as
currency fluctuations, political instability and the potential for illiquid
markets. Past performance is no
guarantee of future results. There is
risk of loss in all trading. Back tested
performance does not represent actual performance and should not be interpreted
as an indication of such performance.
Also, back tested performance results have certain inherent limitations
and differs from actual performance because it is achieved with the benefit of
hindsight.
I plan to bring a lot of material and as much insight as I can muster on the topics of trading systems/strategies, seasonality, options trading and on how to “think like a trader.”
Wishing you all a Happy New Year!
See also Jay Kaeppel Interview in July 2020 issue of Technical Analysis of Stocks and Commodities magazine
Disclaimer: The information, opinions and ideas expressed herein are for
informational and educational purposes only and are based on research conducted
and presented solely by the author. The
information presented represents the views of the author only and does not
constitute a complete description of any investment service. In addition, nothing presented herein should
be construed as investment advice, as an advertisement or offering of
investment advisory services, or as an offer to sell or a solicitation to buy
any security. The data presented herein
were obtained from various third-party sources.
While the data is believed to be reliable, no representation is made as
to, and no responsibility, warranty or liability is accepted for the accuracy
or completeness of such information.
International investments are subject to additional risks such as
currency fluctuations, political instability and the potential for illiquid
markets. Past performance is no
guarantee of future results. There is
risk of loss in all trading. Back tested
performance does not represent actual performance and should not be interpreted
as an indication of such performance.
Also, back tested performance results have certain inherent limitations
and differs from actual performance because it is achieved with the benefit of
hindsight.
The trend is your friend. At least until it is not a trend
anymore. Then it becomes more like an ex
who keeps trying to “lure you back in” with memories of “the good times”, even
though the relationship has unquestionably run its course. In both cases the end is pretty similar.
Investors have been blessed with a
variety of strong and persistent trends in recent years. By getting onboard and staying onboard many
investors have been able to accumulate a great deal of wealth.
But nothing – particularly a trend in
the financial markets – lasts forever. I
(nor anyone else) cannot predict when any particular trend or relationship in
the markets will end. But the one thing
we can do is recognize when a trend or relationship is “getting a little long
in the tooth” and prepare ourselves mentally for the day when we need to walk
(or run, as the case may be) away.
5 Relationships to Watch
I am on the record as believing that
the next 5-10 years in the markets will look much different than the last 10
years. For example, I expect:
*Foreign stocks to outperform U.S.
stocks
*Value to outperform growth
*Commodities to outperform stocks
*Technology to suffer a severe bear
market
*Energy stocks to some day rise from
the dead
Interestingly, I have very little money committed to most of these ideas at the moment. Lacking “courage of conviction?” OK, I don’t claim to be immune. But in this case, it is more a function of the belief that “it’s not so much what you buy but when you buy it that matters.”
And long ago I gave up trying to pick
tops and bottoms. So, for the moment I
am watching and waiting for “signs.” Let
me show you some charts you can use to make your own determination.
Each of the charts below are “relative
strength” charts, NOT price charts. In
other words, the chart displays how one asset is performing relative to
another.
*If the bars in the chart are rising
it means the 1st asset listed is outperforming
*If the bars in the chart are
declining it means the 1st asset listed in underperforming
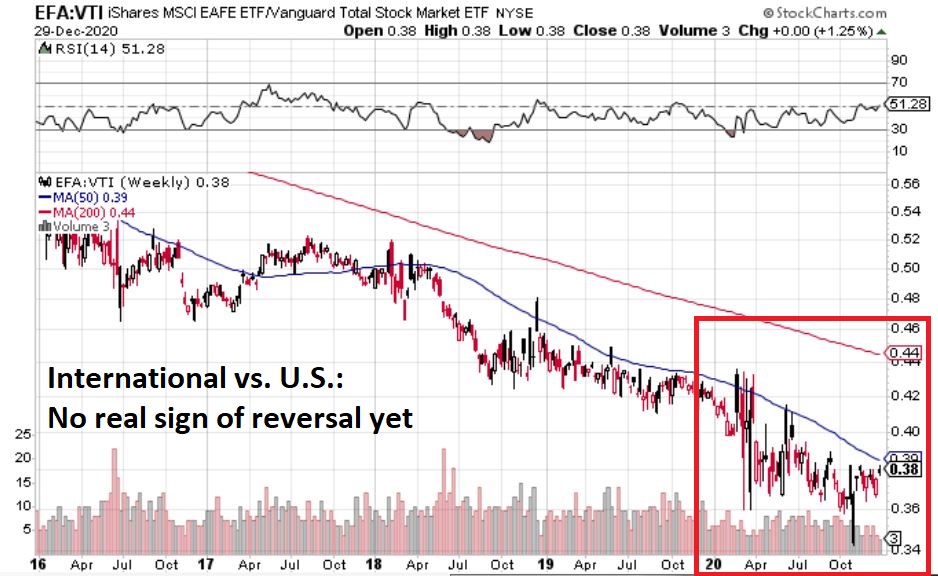
#1. Foreign stocks versus U.S. stocks
Figure 1 displays a weekly chart of
the performance of ticker EFA (iShares MSCI EAFE Index ETF) relative to ticker
VTI (Vanguard Total U.S. Stock Market ETF).
The downward slope illustrates the
fact that U.S. stocks have consistently outperformed in recent years. In addition, there is little sign of a
turnaround yet.
Figure 1 – EFA vs. VTI (Foreign vs. U.S)
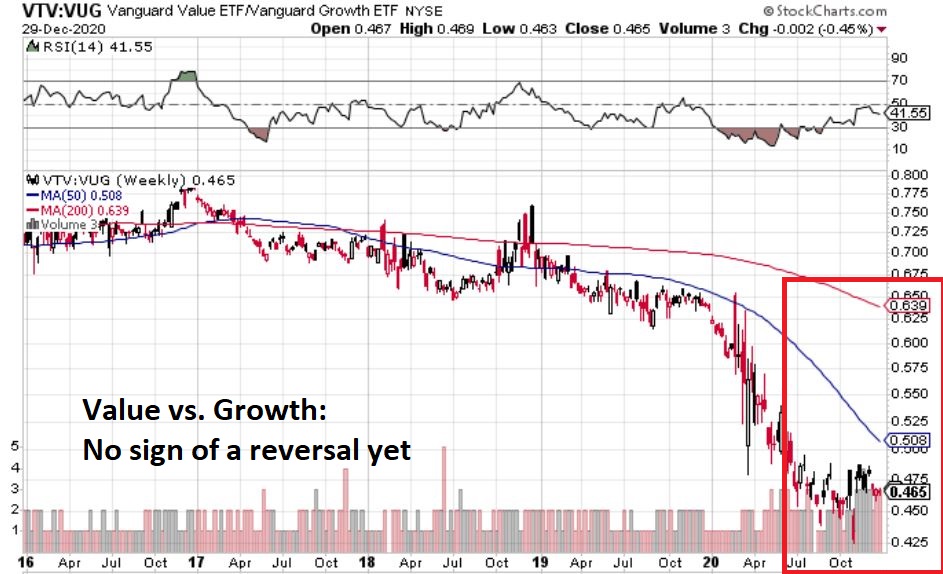
#2. Value vs. Growth
Figure 2 displays a weekly chart of
the performance of ticker VTV (Vanguard Value ETF) relative to ticker VUG (Vanguard
Growth ETF).
The downward slope illustrates the
fact that growth stocks have vastly outperformed value stocks in recent
years. My “opinion” is that value will
almost certainly outperform growth in the decade ahead – and yet I have not
committed any money to value funds or ETFs yet.
Why? There is little sign of a
turnaround in Figure 2 yet.
Figure 2 – VTV vs. VUG (Value vs. Growth)
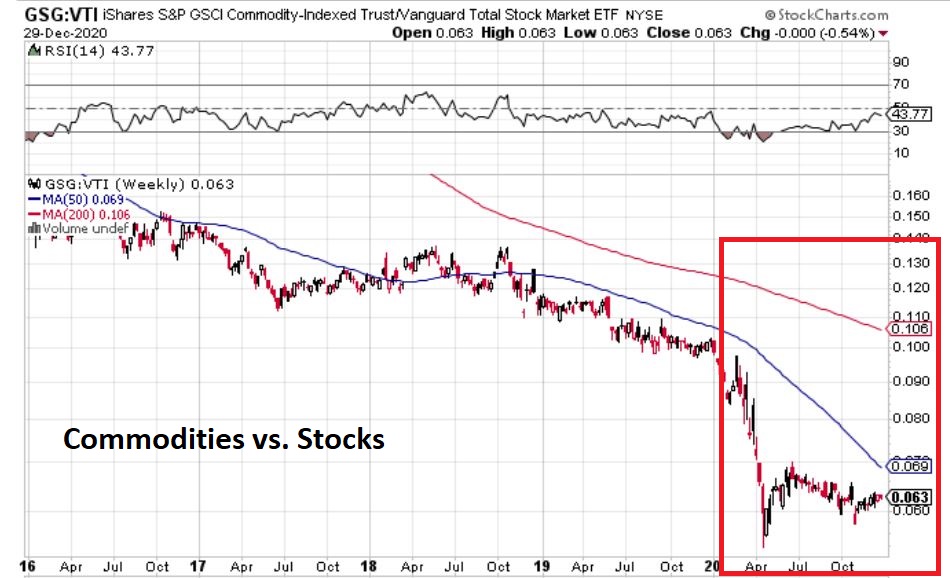
#3. Commodities vs. Stocks
Figure 3 displays a weekly chart of
the performance of ticker GSG (Goldman Sachs Commodity Index ETF) relative to
ticker VTI (Vanguard Total U.S. Market ETF).
My “opinion” here is that commodities
likely represent generational opportunity to “buy cheap”. A number of commodities (Gold, soybeans, lithium,
lumber, copper) have already started to rally, but commodities as an asset
class have not realty outperformed the stock market following the stock market
low in March.
But keep a close eye on Figure 3 for
some sign of a turnaround.
Figure 3 – GSG vs. VTI (Commodities vs. Stocks)
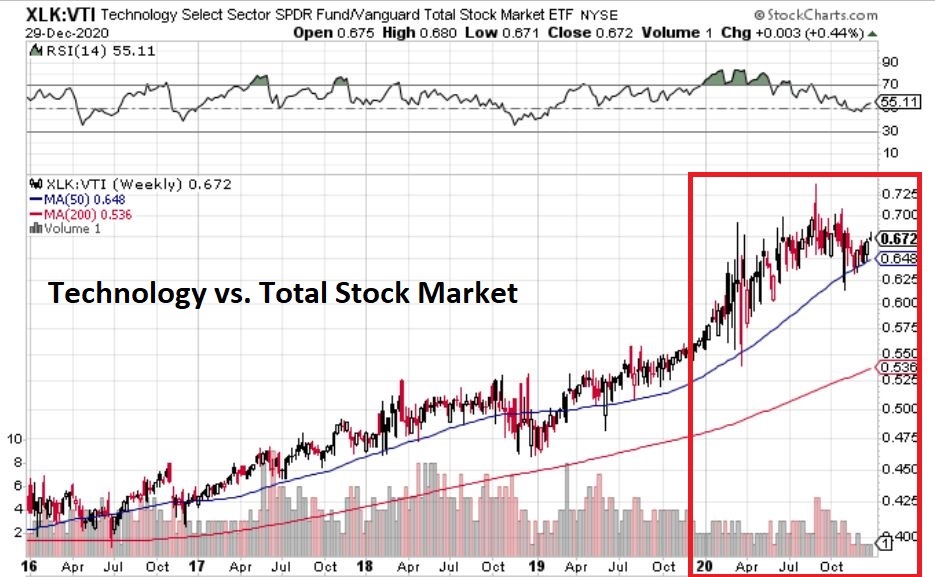
#4. Technology Sector vs. The Total
Stock Market
It is no secret that the tech sector has been the strongest performing sector in each of the last two years. Jason Goepfert at www.Sentimentrader.com wrote a Members Only piece the other day that:
*Identified prior instances when one
sector led everything 2 years in a row
*Highlighted how that sector performed
going forward.
Summarizing as succinctly as possible
without violating any copyrights, “it’s not good.” Which raises an interesting reminder of “how
investor’s minds work.” At this moment
in time, it is pretty much accepted wisdom that “tech is where it’s at” and
that that’s how it is going to be ad infinitum into the future. And yes, technology will continue to evolve
at a rapid pace. But must I remind
everyone that “stock prices fluctuate” (or than AAPL lost -91% in 2000-2002 and
AMZN lost -95% and GOOG lost -97%)? I am
not “predicting” a repeat, but I am very alert to the fact that tech stocks are
“due” for a whack.
Will that happen in 2021? It beats me.
But I will be keeping a close eye on Figure 4 that displays ticker XLK
(SPDR Technology) vs. ticker VTI (Vanguard Total U.S. Market ETF). Enjoy the ride for now because it could
develop into a blowoff top kind of rally.
But whenever this relationship starts to breakdown, run, don’t walk to
the nearest exit.
Figure 4 – XLK vs. VTI (Technology vs. Total U.S. Stock Market)
#5. Energy Stocks vs. Technology
Stocks
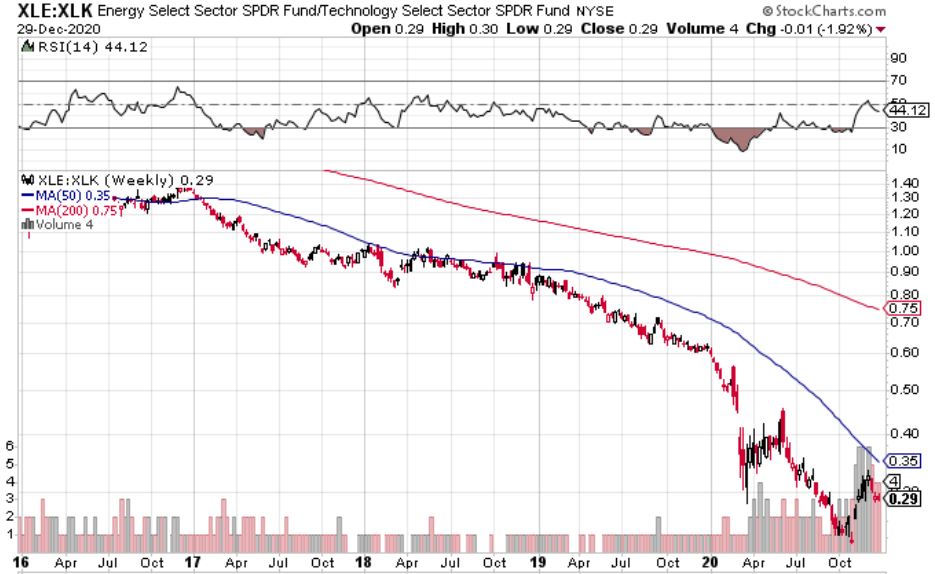
Figure 5 displays a weekly chart of the performance of ticker XLE (SPDR Energy) relative to ticker XLK (SPDR Technology).
The relative performance between two
sectors has rarely if ever been more one sided. While technology led the
universe in recent years, traditional energy stocks have cratered. There is a part of me that things that traditional
energy stocks also represent a generational opportunity. But there is some doubt:
*On one hand, by and large the world
(particularly transportation and particularly flight) still runs on fossil
fuels. And roughly 10 bazillion products
that we use every day are produced using petroleum. So, one can argue that this sector has been
overdone to the downside and now represents great value.
*On the other hand, the drive to move
to “green energy” is not likely to abate.
Figure 5 – XLE vs. XLK (Energy vs. Technology)
You may never see a more one-sided relative performance than this one. While technology led the universe by far in recent years, traditional energy stocks have cratered. There is a part of me that things that traditional energy stocks also represent a generational opportunity. But there is some doubt:
*On one hand, by and large the world
(particularly transportation and particularly flight) still runs on fossil
fuels. And roughly 10 bazillion products
that we use every day are produced using petroleum. So, one can argue that this sector has been
overdone to the downside and now represents great value.
*On the other hand, the drive to move to “green energy” is not likely to abate.
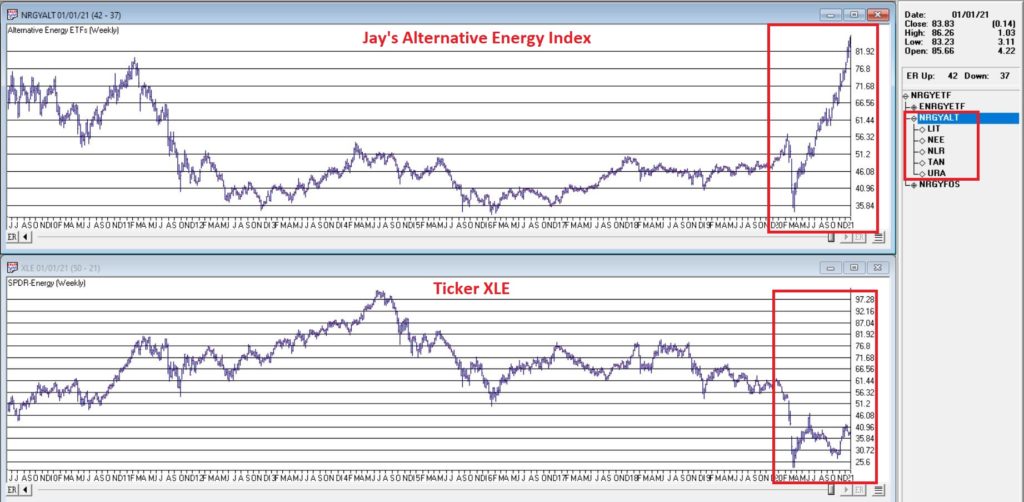
One possibility might be to focus on green energy companies instead of fossil fuel related. Ironically, stocks in the “green energy” sector have performed so well in recent months that they seem a little “overdone” at the moment.
Bonus Chart: “Alternative Energy”
Index versus XLE
Figure 6 displays my own “Alternative
Energy” Index in the top clip and ticker XLE (which is comprised of more
traditional fossil fuel-based companies).
Figure 6 – Alternative Energy Index
vs. Ticker XLE
The differences in recent months are
fairly obvious. So, should one seek “value”
in traditional energy? Or chase
performance with alternative energy?
Just one more thing to keep an eye on
as 2021 dawns.
See also Jay Kaeppel Interview in July 2020 issue of Technical Analysis of Stocks and Commodities magazine
Jay
KaeppelDisclaimer: The information, opinions and ideas expressed
herein are for informational and educational purposes only and are based on
research conducted and presented solely by the author. The information presented represents the
views of the author only and does not constitute a complete description of any
investment service. In addition, nothing
presented herein should be construed as investment advice, as an advertisement
or offering of investment advisory services, or as an offer to sell or a
solicitation to buy any security. The
data presented herein were obtained from various third-party sources. While the data is believed to be reliable, no
representation is made as to, and no responsibility, warranty or liability is
accepted for the accuracy or completeness of such information. International investments are subject to
additional risks such as currency fluctuations, political instability and the
potential for illiquid markets. Past
performance is no guarantee of future results.
There is risk of loss in all trading.
Back tested performance does not represent actual performance and should
not be interpreted as an indication of such performance. Also, back tested performance results have
certain inherent limitations and
And that is true if one looks at
things on a calendar month basis. In
this piece however, we are going to “cut things a little finer.”
Favorable Period for Platinum
For purposes of this piece, we will
define the “Favorable Period” for platinum as:
*The 41 trading days (NOT calendar
days) directly after the 13th trading day of December
Technically this period in 2020
started at the close on 12/17/20 and will extend through the close of trading
on 2/18/2021.
So far in 2020 it is “so far, not so
good”. From the 12/17 close through the
12/24 close platinum has declined from roughly $1,054 and ounce to roughly
$1,027.
So, does this mean that “it is not
working this time around”? Or do we have
a better buying opportunity now than we did on 12/17? The reality is that I can’t answer those
questions. All I can do is highlight the
history and let everyone else make up their own mind.
The History
I have platinum futures historical
data going back to October of 1977. So,
we start our test in December 1977 and assume that a trader held a 1-lot of
platinum futures (more on an ETF alternative later) every year during the “favorable
period” defined above. Each full point
movement for a platinum futures contract equals $50. So, if platinum futures advanced 10 points
then the trader gains $500 and vice versa.
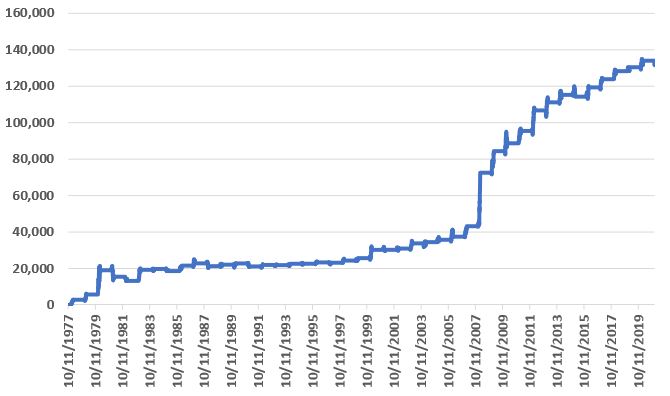
Figure 2 displays the cumulative hypothetical
$ +(-) achieved by holding platinum ONLY during the favorable 41-day period
every year.
Figure 2 – Cumulative $ +(-) for
holding 1-lot of platinum futures during 41-day Favorable Period every year
(1978-2020)
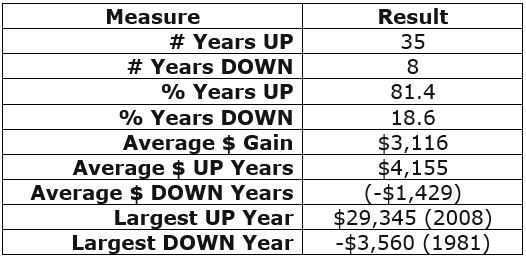
Figure 3 displays some relevant facts
and figures.
Figure 3 – Facts and Figures
As you can see in Figures 2 and 3:
*This favorable 41 trading day period
is “no sure thing”
*However, if you were going to bet on
a direction during this period, the bullish side appears to be the better bet
An ETF Alternative
While the above is all very
interesting on a theoretical basis, the reality is that a very low percentage
of traders will ever touch a platinum futures contract (or should ever touch a
platinum futures contract, given the inherent associated risks).
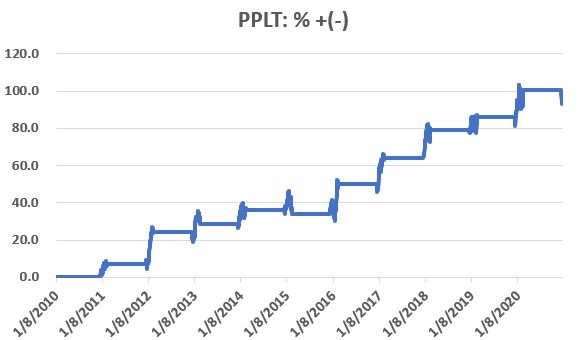
One alternative is to trade shares of
ticker PPLT (Aberdeen Standard Physical Platinum Shares ETF). Figure 4 displays the cumulative hypothetical
price return for PPLT ONLY during the 41-day favorable period since the ETF was
created in 2010.
Figure 4 – Cumulative % + (-) for
ticker PPLT during Favorable Period
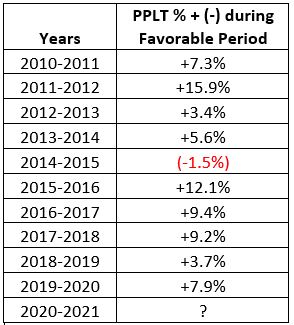
Figure 5 displays the year-by-year results
for PPLT during the Favorable Period.
Figure 5 – PPLT %+(-) year-by-year
during Favorable Period
During the 1st five trading days of this years “Favorable Period”, PPLT has declined -1.8%.
Summary
The good news about seasonal trends
is that they can often afford you an “edge” in the markets. The bad news about seasonal trends is that
you never know if a given trend will play out as expected “this time around” –
so a certain leap of faith is required.
One’s choices regarding platinum
between now and 2/28/2021 are:
*Bet a lot
*Bet a little
*Bet nothing at all
Choose wisely.
See also Jay Kaeppel Interview in July 2020 issue of Technical Analysis of Stocks and Commodities magazine
Disclaimer: The information, opinions and ideas expressed herein are for
informational and educational purposes only and are based on research conducted
and presented solely by the author. The
information presented represents the views of the author only and does not
constitute a complete description of any investment service. In addition, nothing presented herein should
be construed as investment advice, as an advertisement or offering of
investment advisory services, or as an offer to sell or a solicitation to buy
any security. The data presented herein
were obtained from various third-party sources.
While the data is believed to be reliable, no representation is made as
to, and no responsibility, warranty or liability is accepted for the accuracy
or completeness of such information.
International investments are subject to additional risks such as
currency fluctuations, political instability and the potential for illiquid
markets. Past performance is no
guarantee of future results. There is
risk of loss in all trading. Back tested
performance does not represent actual performance and should not be interpreted
as an indication of such performance.
Also, back tested performance results have certain inherent limitations
and differs from actual performance because it is achieved with the benefit of
hindsight.
A strong argument can be made that it’s not “what you buy” but “when you buy it” that matters most. Certainly not every trader would agree with that statement (which is a good thing otherwise we would have no one to trade with). But with this thought in mind, let’s jump ahead and take a brief look into 2021.
2021: By the Calendar
As it fits into the 4-year election
cycle 2021 is a “post-election” year.
Post-election years have a reputation as being “unfavorable” for the
stock market. In reality, they are
“about average” for the stock market. If
we look at price only performance for the Dow Industrial Average every
post-election starting in 1901, we find:
*16 times up, 14 times down – a 53.3%
win rate
*Average % gain = +6.8%
Now let’s break the post-election
year down a little finer:
*”Favorable” period = March, April, May, July and December
*”Unfavorable” period = All other months
The Test
So let’s look at the cumulative
returns one might have achieved if a person (had lived to be a very ripe old age,
and);
*Held the Dow ONLY during the
“Favorable” months
OR
*Held the Dow ONLY during “all other
months”
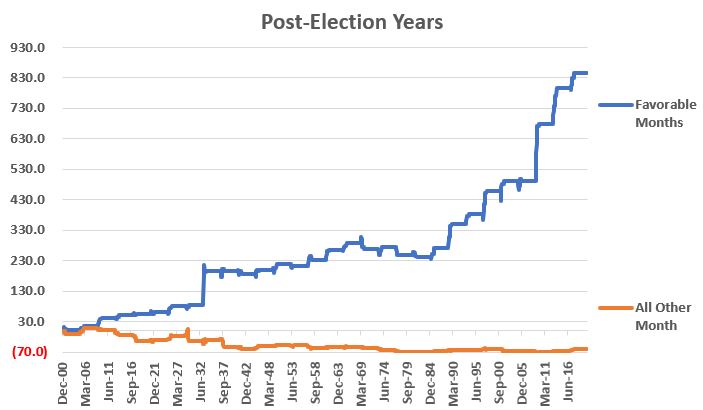
The blue line in Figure 1 displays the cumulative growth achieved ONLY during the “favorable” post-election year months of March, April, May, July and December.
The orange line displays the
cumulative growth achieved only during “all other” post-election months.
Figure 1 – Post-Election Years “Favorable Months” cumulative price gain (blue) versus “All Other Months” cumulative price gain (orange); 1901-present
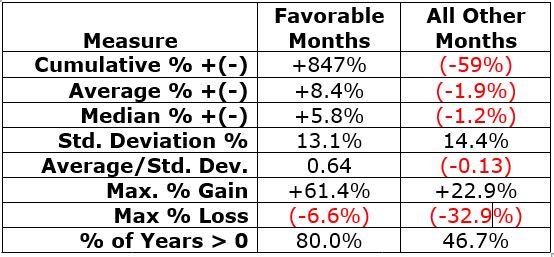
Figure 2 displays the relevant facts and figures.
Figure 2 – Post-Election Years “Favorable Months” versus “All Other Months”; 1901-present
The key things to note:
*The “favorable months” achieved a cumulative return of +847%; the “unfavorable months” achieved a loss of -59%
*The “favorable months” showed an annual gain 80% of the time (versus 53% for buy and hold and 47% for “all other months”)
*The average and median results for “favorable months” were positive, while the average and median results for “all other months” were negative.
*The worst annual loss achieved during “favorable months” only was -6.6%. The worst annual loss for “all other months” was -32.9%
Summary
Post-election years have seen the Dow
gain 53% of the time since 1901 for a cumulative price gain of +286%.
However, a trader who held the Dow ONLY
during April, May, July and December of each post-election year enjoyed an “Up”
post-election year 80% of the time with a cumulative price gain of +640%.
Is this “edge” guaranteed to play out
in 2021? Not at all. But it might be worth remembering.
See alsoJay Kaeppel Interview in July 2020 issue of Technical Analysis of Stocks and Commodities magazine
Disclaimer: The information, opinions and ideas expressed herein are for
informational and educational purposes only and are based on research conducted
and presented solely by the author. The
information presented represents the views of the author only and does not
constitute a complete description of any investment service. In addition, nothing presented herein should
be construed as investment advice, as an advertisement or offering of
investment advisory services, or as an offer to sell or a solicitation to buy
any security. The data presented herein
were obtained from various third-party sources.
While the data is believed to be reliable, no representation is made as
to, and no responsibility, warranty or liability is accepted for the accuracy
or completeness of such information.
International investments are subject to additional risks such as
currency fluctuations, political instability and the potential for illiquid
markets. Past performance is no
guarantee of future results. There is
risk of loss in all trading. Back tested
performance does not represent actual performance and should not be interpreted
as an indication of such performance.
Also, back tested performance results have certain inherent limitations
and differs from actual performance because it is achieved with the benefit of
hindsight.
In many ways the markets imitate
life. For example, the trend is your
friend. You may enjoy your friendship
with the trend for an indefinite length of time. But the moment you ignore it – or just simply
take it for granted that this friendship is permanent, with no additional effort
required on your part – that’s when the trouble starts.
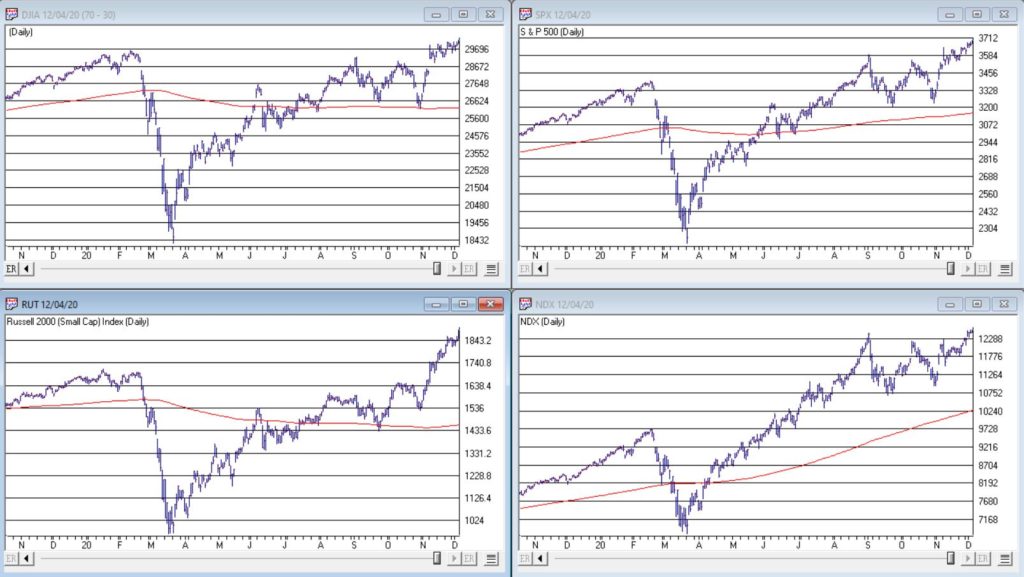
For the stock market right now, the bullish trend is our friend. Figure 1 displays the 4 major indexes all above their respective – and rising – long-term moving averages. This is essentially the definition of a “bull market.”
In addition, a number of indicators
that I follow have given bullish signals in the last 1 to 8 months. These often remain bullish for up to a
year. So, for the record, with my
trusted trend-following, oversold/thrust and seasonal indicators mostly all
bullish I really have no choice but to be in the bullish camp.
Not that I am complaining mind you. But like everyone else, I try to keep my eyes open for potential signs of trouble. And of course, there are always some. One of the keys to long-term success in the stock market is determining when is the proper time to actually pay attention to the “scary stuff.” Because scary stuff can be way early or in other cases can turn out to be not that scary at all when you look a little closer.
So, let’s take a closer look at some
of the scary stuff.
Valuations
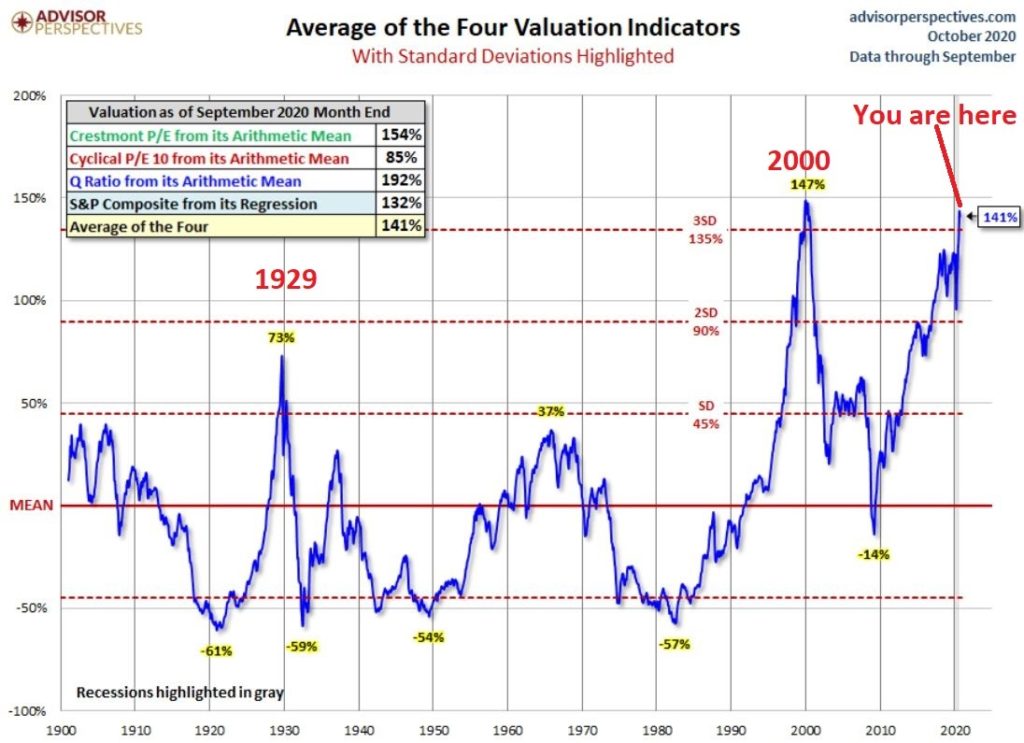
Figure 2 displays an aggregate model
of four separate measures of valuation.
The intent is to gain some perspective as to whether stocks are overvalued,
undervalued or somewhere in between.
Clearly the stock market is “overvalued” if looked at from a historical perspective. The only two higher readings preceded the tops in 1929 (the Dow subsequently lost -89% of its value during the Great Depression) and 2000 (the Nasdaq 100 subsequently lost -83% of its value).
Does this one matter? Absolutely. But here is what you need to know:
*Valuation IS NOT a timing indicator. Since breaking out to a new high in 1995 the
stock market has spent most of the past 25 years in “overvalued” territory. During this time the Dow Industrials have
increased 700%. So, the proper response
at the first sign of overvaluation should NOT be “SELL.”
*However, ultimately valuation DOES matter.
Which leads directly to:
Jay’s Trading Maxim #44: If you are walking down the street and you trip and fall that’s one thing. If you are climbing a mountain and you trip and fall that is something else. And if you are gazing at the stars and don’t even realize that you are climbing a mountain and trip and fall – the only applicable phrase is “Look Out Below”.
So, the proper response is this:
instead of walking along and staring at the stars, keep a close eye on the
terrain directly in front of you. And
watch out for cliffs.
Top 5 companies as a % of S&P 500
Index
At times through history certain
stocks or groups of stocks catch “lightning in a bottle.” And when they do the advances are
spectacular, enriching anyone who gets on board – unless they happen to get on
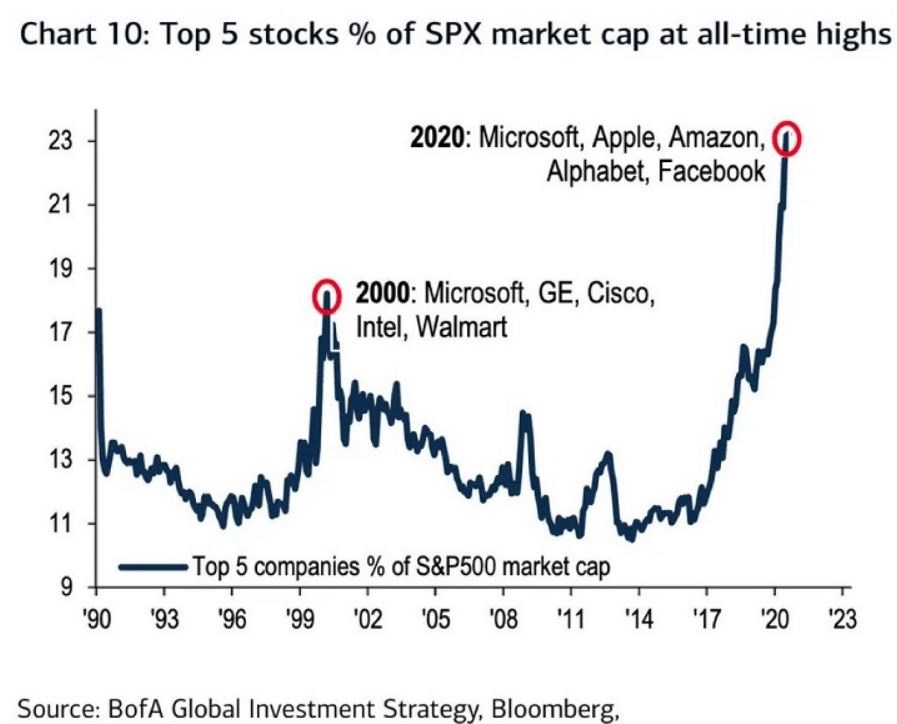
board too late. Figure 3 displays the
percentage of the S&P 500 Index market capitalization made up by JUST the 5
largest cap companies in the index at any given point in time.
Figure 3 – Top 5 stocks as a % of
S&P 500 Index market cap (Courtesy: www.Bloomberg.com)
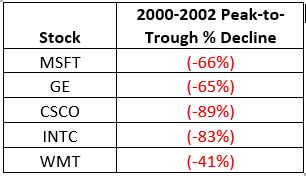
The anecdotal suggestion is pretty obvious. Following the market peak in 2000, the five stocks listed each took a pretty significant whack as shown in Figure 4.
Figure 4 – Top Stocks after the 2000 Peak
Then when we look at how far the line in Figure 3 has soared in 2020 the obvious inference is that the 5 stocks listed for 2020 are due to take a similar hit. And here is where it gets interesting. Are MSFT, AAPL, AMZN, GOOGL and FB due to lose a significant portion of their value in the years directly ahead?
Two thoughts:
*There is no way to know for sure
until it happens
*That being said, my own personal option
is “yes, of course they are”
But here is where the rubber meets
the road: Am I presently playing the bearish side of these stocks? Nope.
The trend is still bullish. Conversely,
am I keeping a close eye and am I willing to play the bearish side of these
stocks? Yup. But not until they – and the overall market –
actually starts showing some actual cracks.
One Perspective on AAPL
Apple has been a dominant company for
many years, since its inception really.
Will it continue to be? I
certainly would not bet against the ability of the company to innovate and grow
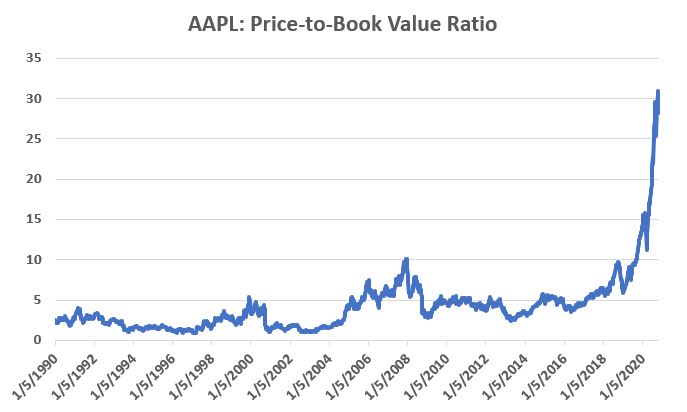
its earnings and sales in the years ahead. Still timing – as they say – is everything. For what it is worth, Figure 5 displays the
price-to-book value ratio for AAPL since January 1990.
Figure 5 – AAPL price-to-book value ratio (Data courtesy of Sentimentrader.com)
Anything jump out at you?
Now one can argue pretty compellingly that price-to-book value is not the way to value a leading technology company. And I probably agree – to a point. But I can’t help but look at Figure 5 and wonder if that point has possibly been exceeded.
Summary
Nothing in this piece is meant to
make you “bearish” or feel compelled to sell stocks. For the record, I am still in the bullish
camp. But while this information DOES
NOT constitute a “call to action”, IT DOES constitute a “call to pay close
attention.”
Bottom line: enjoy the bull market
but DO NOT fall in love with it.
See also Jay Kaeppel Interview in July 2020 issue of Technical Analysis of Stocks and Commodities magazine
Disclaimer: The information, opinions and ideas expressed herein are for
informational and educational purposes only and are based on research conducted
and presented solely by the author. The
information presented represents the views of the author only and does not
constitute a complete description of any investment service. In addition, nothing presented herein should
be construed as investment advice, as an advertisement or offering of
investment advisory services, or as an offer to sell or a solicitation to buy
any security. The data presented herein
were obtained from various third-party sources.
While the data is believed to be reliable, no representation is made as
to, and no responsibility, warranty or liability is accepted for the accuracy
or completeness of such information.
International investments are subject to additional risks such as
currency fluctuations, political instability and the potential for illiquid
markets. Past performance is no
guarantee of future results. There is
risk of loss in all trading. Back tested
performance does not represent actual performance and should not be interpreted
as an indication of such performance.
Also, back tested performance results have certain inherent limitations
and differs from actual performance because it is achieved with the benefit of
hindsight.
Good news! Silver is above its price level of a year ago AND it is December! OK, maybe that is a bit too succinct. Perhaps a little more detail is in order.
Silver had a pretty terrific run from the March 2020 low to the July 2020 high, with silver futures rallying from 11.26 to 29.92 (to put it in more stark terms, the $ value of a silver futures contract increased from $56,300 to $149,600). But in recent weeks the “less shiny” metal has experienced enough of a pullback that a lot of traders are starting to turn away and refocusing on the soaring stock market.
While I claim no ability to “predict” the future price of silver, I have noticed that a couple of trends are presently suggesting that right now may be a good time NOT to give up on the stuff.
Two Factors Combined
For our purposes we will combine two
factors:
*Factor #1: The change in the
price of silver over the previous year
*Factor #2: The current month
of the year
From this we can create “Jay’s Silver
Model” (such as it is) as follows:
*If silver is above its price of 252
trading days ago then add +1 to the Model
*If the current month is January,
February, July, August, November or December then add +1 to the model
And there you have it. For any given trading day, the Model will
read 0, +1 or +2.
From here we will accumulate the
daily $ +(-) for a silver futures contract (each $1 movement in the price of a
silver futures contract is worth $5,000) based on the daily reading for Jay’s
Silver Model. The first date of the test
is July 20, 1971.
Does this matter? Well consider the following:
When Model = +2: Cumulative silver $ +(-) = +$273,205
When Model = +1: Cumulative silver $ +(-) = (-$57,700)
When Model = 0: Cumulative silver $ +(-) = (-$110,095)
In other words:
*While the Model read +2, silver gained
+$273,205
*While the Model was less than +2,
silver lost (-$167,865)
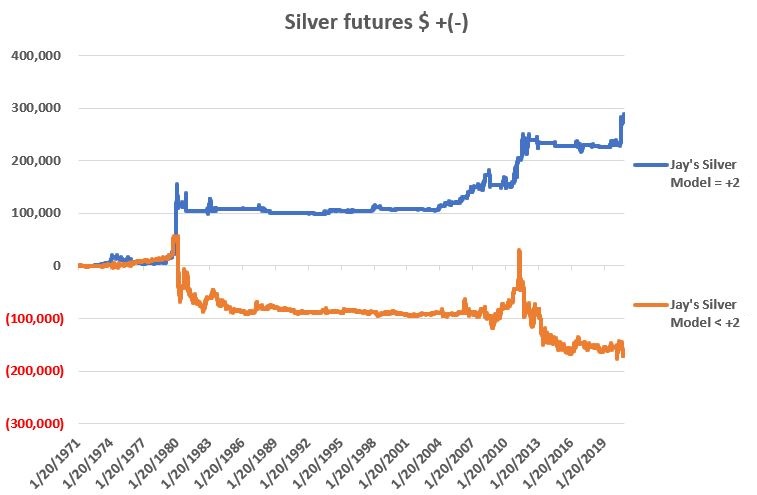
Figure 1 displays the cumulative
results.
Figure 1 – Cumulative $ +(-) for
silver futures is Jay’s Silver Model = +2 (blue) or Jay’s Silver Model < 2
(red); 1971-2020
The bad new “things” to note from
Figure 1 are:
*Silver can spend A LOT of time going
nowhere – even if the Model = +2
*There can ALWAYS be countertrend bullish
moves – even if the Model < +2
Still, the stark difference between
the two lines suggests that there might be some useful information – at the
very least on a “wight of the evidence” basis – conveyed for anyone looking to
trade silver.
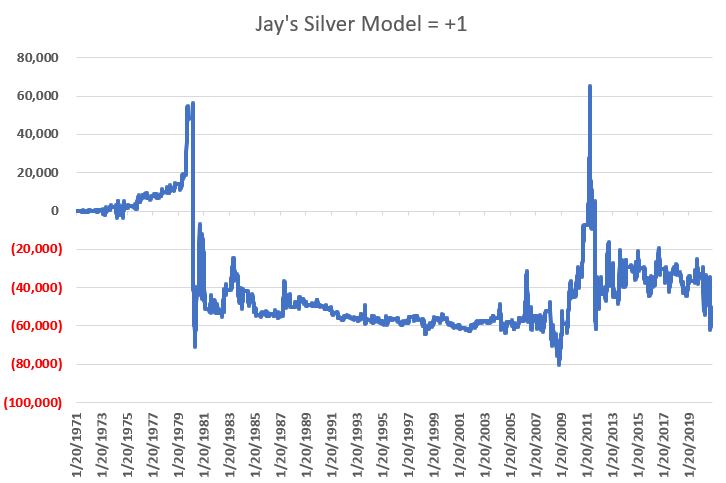
One other “interesting note” appears in Figures 2 and 3. Figure 2 displays the cumulative results for silver futures when the Model reads +1 and Figure 3 when the Model reads 0.
Figure 2 – Cumulative $ +(-) for
silver futures is Jay’s Silver Model = +1; 1971-2020
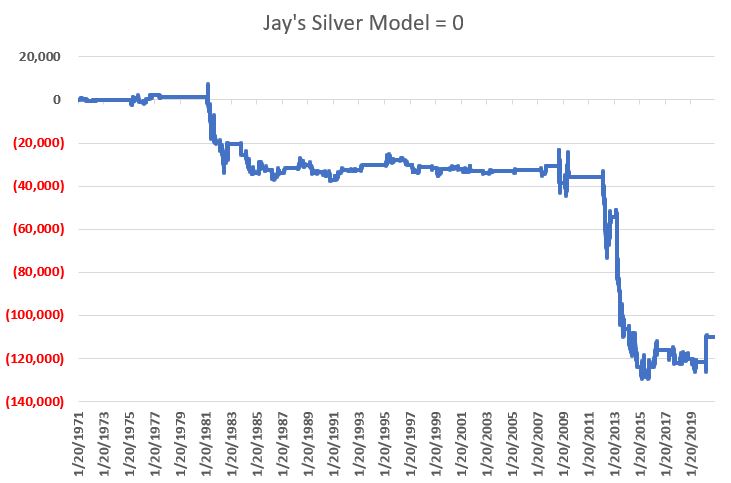
Figure 3 – Cumulative $ +(-) for
silver futures is Jay’s Silver Model = 0; 1971-2020
Note in Figure 2 that there were several massive countertrend rallies in silver while the Model read +1. However, in Figure 3 we see that very little good ever happens for silver when the Model reads 0.
To reiterate, Figure 3 displays the $ gain/loss from holding a long position in silver futures when:
A) silver is below its price level of 1 year ago (for the record I use 252 trading days with a 1-day lag) AND
B) The current month is NOT Jan., Feb., Jul., Aug., Nov. or Dec
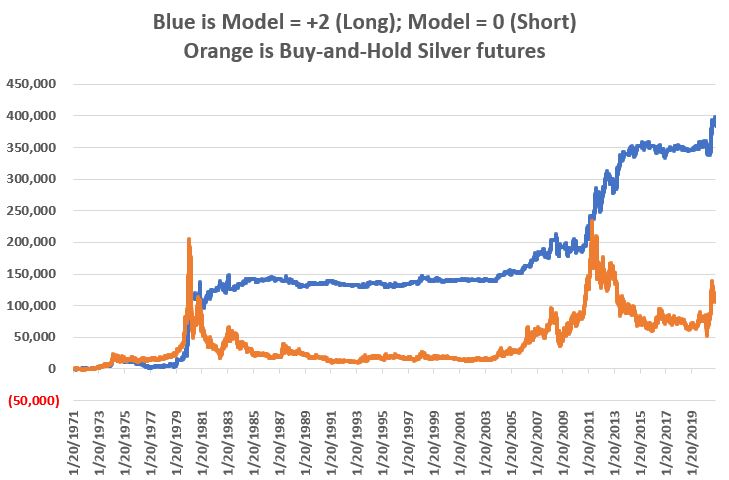
Figure 4 displays the cumulative
(hypothetical) gain generated by:
*Holding a long position in silver
futures when the Model = +2
*Holding a flat position in silver
futures when the Model = +1
*Holding a short position in silver
futures when the Model = 0
Also displayed is the cumulative gain
from buying and holding a silver futures contract.
Figure 4 – Cumulative $ +(-) for
silver futures holding a long position if Jay’s Silver Model = +2 and a short
position if Jay’s Silver Model = 0; 1971-2020
The Current State of Affairs
*Silver is well above its price of one year ago (and that will remain the case as long as silver holds above roughly $18). So, Part 1 of the Model is positive.
*In addition, the second part of the model will remain bullish through the end of February 2021.
The bottom line is that the Model is pretty much “stuck on +2” for another 3 months. Does this “guarantee” that silver is certain to rise in the months ahead? Not at all. The Model was bullish all of November and during that time silver peaked and declined by 15% from that peak. So, there is nothing “magical” going on just because this silly little “Model” reads +2.
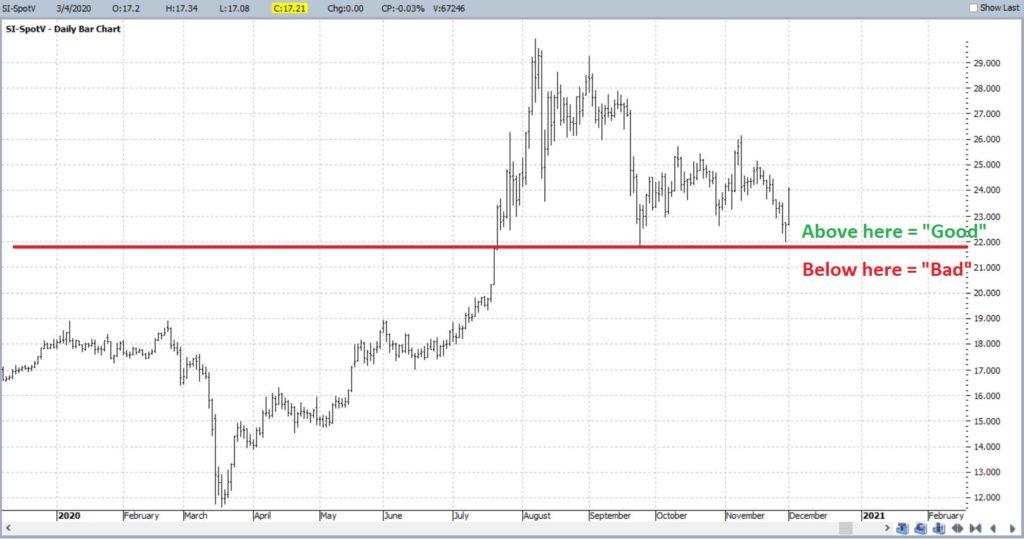
But history suggests that if you are going to play silver, it might be most prudent to play it from the long side, particularly as long as the recent support level of $21.81 (see Figure 5) holds.
Disclaimer: The information, opinions and ideas expressed herein are for
informational and educational purposes only and are based on research conducted
and presented solely by the author. The
information presented represents the views of the author only and does not constitute
a complete description of any investment service. In addition, nothing presented herein should
be construed as investment advice, as an advertisement or offering of
investment advisory services, or as an offer to sell or a solicitation to buy
any security. The data presented herein
were obtained from various third-party sources.
While the data is believed to be reliable, no representation is made as
to, and no responsibility, warranty or liability is accepted for the accuracy
or completeness of such information.
International investments are subject to additional risks such as
currency fluctuations, political instability and the potential for illiquid
markets. Past performance is no
guarantee of future results. There is
risk of loss in all trading. Back tested
performance does not represent actual performance and should not be interpreted
as an indication of such performance.
Also, back tested performance results have certain inherent limitations
and differs from actual performance because it is achieved with the benefit of
hindsight.
It is not exactly a little-known fact
that the performance of small-cap stocks relative to large-cap stocks
experiences something of an ebb and flow.
It is also not exactly a secret that December into February has tended
to see the market favor small-caps. I
will explain why this is as soon as I come up with something plausible. Kidding.
As a proud graduate of “The School of Whatever Works” I tend to spend
less time focusing on “Why” and more time focusing on “When.”
The Small-Cap Sweet Spot
Our supposed “favorable period” for
small-caps extends:
*From the close on December Trading Day #11 (12/15/20 this year) through the close of February Trading Day #11 (2/16/2021)
The Test
How has this worked out in the past? To test results, we will use the Russell 2000 (RUT) to measure small-cap performance and the Russell 1000 (RUI) to measure large-cap performance. Note that all results use price data only, NOT total return.
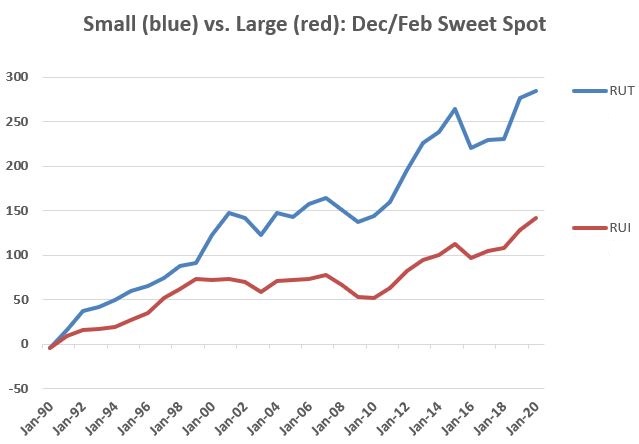
Figure 1 displays the cumulative %
growth for both small-cap and large-cap ONLY during the Small-Cap Sweet Spot
Now if I were smart, I would state something
like “so clearly small-caps outperform large-caps during mid-Dec through
mid-Feb!” and “The End.”
Unfortunately, I am not that smart.
Because the reality is that there is nothing “certain” about this relationship and as it turns out, even during a seemingly favorable for small-caps period there is still an “ebb and flow”. First some numbers.
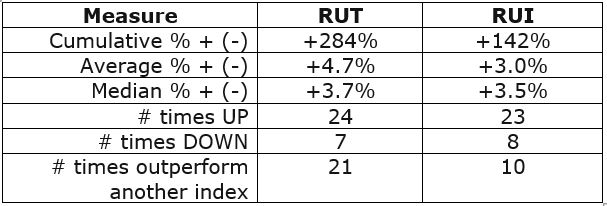
Figure 2 – Facts and Figures
Clearly small-caps have tended to
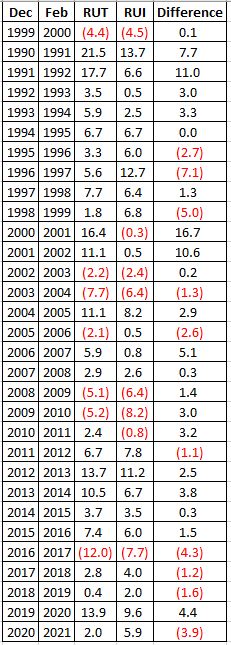
outperform large caps during mid-Dec through mid-Feb. But there are a few caveats to keep in mind:
#1. There can and will be losing periods
RUT has lost money mid-Dec to mid-Feb
in 7 of the last 31 years. While a 77%-win
rate is outstanding in the financial markets, it also means that loses occurred
23% of the time. No one gets into
small-caps in mid-December and gets out with a loss two months later and says, “Well,
at least there is still a 77%-win rate!”
They get out and say “Well that sucked” and shake their head wondering “what
did I think that was a good idea?”
Which lends itself nicely to invoking….
Jay’s Trading Maxim #27: In the financial markets, the difference between theory
and reality can occasionally be a chasm a mile wide.
#2. Losses can be relatively large
In 2003-2004 RUT lost -7.7% during
the Sweet Spot and in 2016-2017 the loss was -12.0%. So, there’s that (you have officially been
warned).
One piece of positive news, when it
comes to double-digit gains and losses:
*# times RUT Sweet Spot gain > 10%
= 8
*# times RUT Sweet Spot loss < -10% = 1
#3. RUT has underperformed RUI in four of the last five “Sweet Spots”
As I said, there is no “sure thing” here. For the record, there is a part of me that suspects that since things have “ebbed” in 4 of the last 5 years (i.e., small underperforming large), that a return to “flow” (i.e., small-caps outperforming) may be in the cards. Unfortunately, only time will tell.
Summary
Small-cap stocks have demonstrated a
historical seasonal tendency to, a) advance in price, and, b) outperform large
caps during the Seasonal Sweet Spot detailed above.
Whether or not it is worth attempting
to exploit via an actual trade is left to the reader.
Figure 3 – Year-by-year results
See also Jay Kaeppel Interview in July 2020 issue of Technical Analysis of Stocks and Commodities magazine
Disclaimer: The information, opinions and ideas expressed herein are for
informational and educational purposes only and are based on research conducted
and presented solely by the author. The
information presented represents the views of the author only and does not
constitute a complete description of any investment service. In addition, nothing presented herein should
be construed as investment advice, as an advertisement or offering of
investment advisory services, or as an offer to sell or a solicitation to buy
any security. The data presented herein
were obtained from various third-party sources.
While the data is believed to be reliable, no representation is made as
to, and no responsibility, warranty or liability is accepted for the accuracy
or completeness of such information.
International investments are subject to additional risks such as
currency fluctuations, political instability and the potential for illiquid
markets. Past performance is no
guarantee of future results. There is
risk of loss in all trading. Back tested
performance does not represent actual performance and should not be interpreted
as an indication of such performance.
Also, back tested performance results have certain inherent limitations
and differs from actual performance because it is achieved with the benefit of
hindsight.
The trading days around holidays have a long-term tendency to be bullish for the stock market. While I typically stick to the “3 trading days before and 3 trading days after” a holiday as “the bullish period”, with Thanksgiving it might make sense to cut things a little finer.
The Big 3 Turkey Days
The best time around Thanksgiving has
tended to be the two trading days before (Tuesday and Wednesday) and the day
after (Friday). The good news is that period
has been consistently bullish over time.
The “bad news” is that it appears to have been slightly less effective in
recent years.
For our purposes we will measure the price
change for the Dow Jones Industrial Average from the close on Monday the week
of Thanksgiving and the close on Friday of the same week.
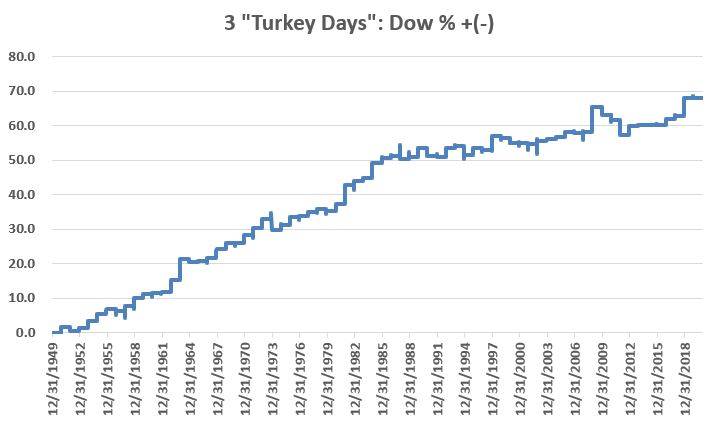
Figure 1 displays the cumulative %
growth.
Figure 1 – Cumulative Dow % +(-) 2
days before and 1 day after Thanksgiving; 1950-2019
The cumulative growth from 1950
through 2019 was +68.0%. If that doesn’t
seem like much just remember that we are talking about just 3 trading days a
year.
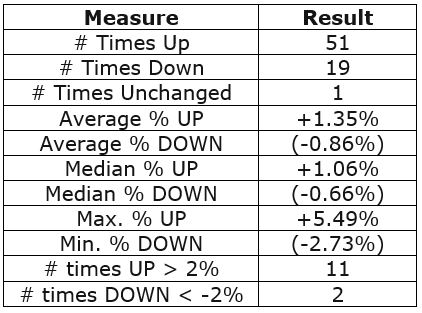
Figure 2 displays some of the relevant facts and figures
Figure 2 – Relevant Facts and Figures
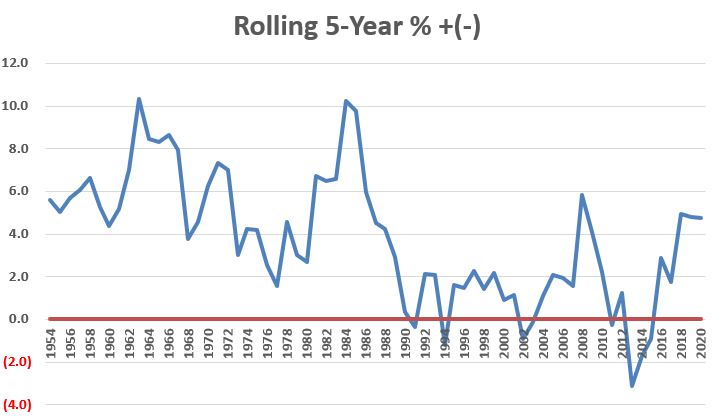
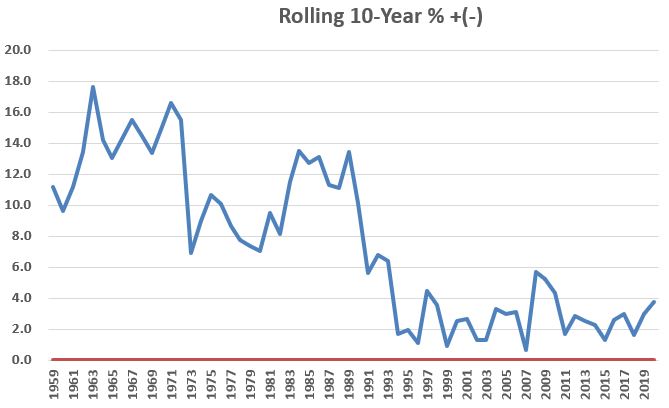
Figure 3 displays the rolling 5-year
return and Figure 4 displays the rolling 10-year return. For what it is worth,
returns have come down in recent years.
This may be due to more people being aware of these types of seasonal
trends (thanks to blabbermouths like yours truly?).
Figure 3 – Rolling 5-year returns
Figure 4 – Rolling 10-year returns
Figure 5 below displays the year-by-year 3-day results for the Dow.
Year
3 “Turkey” Day Dow % +(-)
1950
1.7
1951
(1.1)
1952
0.9
1953
1.7
1954
2.2
1955
1.2
1956
(0.4)
1957
1.2
1958
2.3
1959
0.9
1960
0.3
1961
0.3
1962
3.0
1963
5.5
1964
(0.8)
1965
0.2
1966
0.6
1967
2.3
1968
1.4
1969
(0.1)
1970
1.8
1971
1.7
1972
2.0
1973
(2.4)
1974
1.1
1975
1.8
1976
0.1
1977
1.0
1978
0.6
1979
(0.4)
1980
1.5
1981
4.0
1982
0.7
1983
0.7
1984
3.0
1985
1.1
1986
0.4
1987
(0.7)
1988
0.4
1989
1.7
1990
(1.5)
1991
(0.3)
1992
1.8
1993
0.4
1994
(1.6)
1995
1.3
1996
(0.4)
1997
2.6
1998
(0.4)
1999
(0.9)
2000
0.1
2001
(0.2)
2002
0.5
2003
0.4
2004
0.3
2005
1.0
2006
(0.3)
2007
0.2
2008
4.6
2009
(1.3)
2010
(0.8)
2011
(2.7)
2012
1.7
2013
0.1
2014
0.1
2015
0.0
2016
1.0
2017
0.5
2018
3.2
2019
(0.1)
2020
?
Figure 5 – Year-by-year results
Happy Thanksgiving!
See also Jay Kaeppel Interview in July 2020 issue of Technical Analysis of Stocks and Commodities magazine
Disclaimer: The information, opinions and ideas expressed herein are for
informational and educational purposes only and are based on research conducted
and presented solely by the author. The
information presented represents the views of the author only and does not constitute
a complete description of any investment service. In addition, nothing presented herein should
be construed as investment advice, as an advertisement or offering of
investment advisory services, or as an offer to sell or a solicitation to buy
any security. The data presented herein
were obtained from various third-party sources.
While the data is believed to be reliable, no representation is made as
to, and no responsibility, warranty or liability is accepted for the accuracy
or completeness of such information.
International investments are subject to additional risks such as
currency fluctuations, political instability and the potential for illiquid
markets. Past performance is no
guarantee of future results. There is
risk of loss in all trading. Back tested
performance does not represent actual performance and should not be interpreted
as an indication of such performance.
Also, back tested performance results have certain inherent limitations
and differs from actual performance because it is achieved with the benefit of
hindsight.
The U.S. Dollar has been in a pretty
prolonged slump since spiking to a top in March of this year. Any chance for a rebound? Sure, there is always a chance. The buck is pretty oversold and trader
sentiment – a typically contrarian indicator – is pretty darn negative. So, a “bounce” would not be entirely
unexpected.
Still, the view from where I sit is
that the dollar is in the midst of a longer-term decline.
The Long-Term Cycle
I read a number of years ago about a
16-year cycle for the U.S. dollar.
Unfortunately, I can’t remember where I read it so I cannot give proper
credit. I have read about this cycle
again recently. For the record, it seems
to follow the cycle with a slightly different start/end date than some sources
I have seen recently. No matter. We are not talking about “precision market
timing” here, just a basic overarching trend.
So, let’s take a closer look.
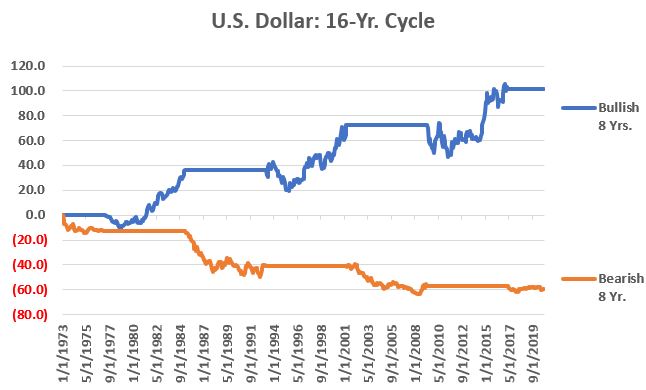
The U.S. Dollar 16-Year Cycle
The first full 16-year cycle – by my account – began on 3/31/1969 (NOTE: the first date of data I have available is 1/31/1973 – so results below start in 1973). The “bearish” phase ran from then through 3/31/1977 and the “bullish” phase ran from 3/31/1977 through 3/31/1985. And so on and so forth. Figure 1 displays the cumulative % growth achieved by holding a hypothetical long position in the U.S. dollar during all bullish phases (blue line) and bearish phases (orange line).
Figure 1 – Cumulative % +(-) for U.S.
dollar during Bullish 8 year phases (blue) and Bearish 8 year phases (orange)
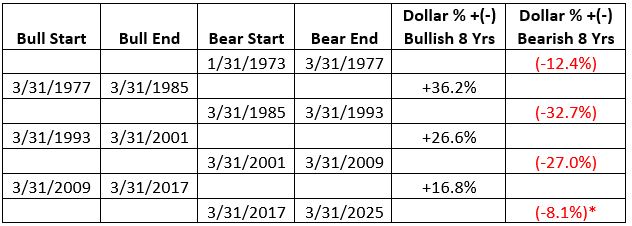
Figure 2 displays the results by the numbers.
Figure 2 – U.S. Dollar during bull and bear phases of 16-year cycle (NOTE: 1st Bearish Phase began 3/31/1969, HOWOEVER, the 1st day of available data is 1/31/1973)
The latest phase – a bearish phase –
began on 3/31/2017 and extends through 3/31/2025. Does that mean the dollar is doomed to
decline relentlessly for another 4+ years?
Not at all. It does tell us
however, that it may be wise to favor the bearish side on any trade involving
the U.S. dollar.
Digging a Little Deeper
Historically the most challenging
time for the dollar is:
*During the months of June through
December when the 16-year cycle is in a bearish phase
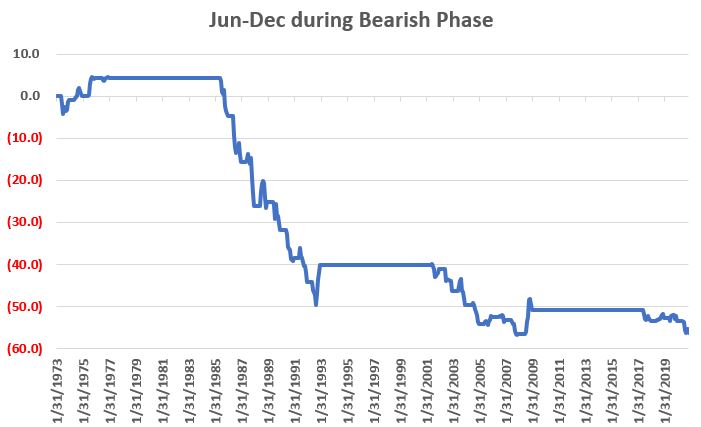
Figure 3 displays the cumulative %
growth achieved by holding a hypothetical long position in the U.S. dollar ONLY
during the months of June through December during those years when the 16-year
cycle is bearish (the most recent such period began on June 1st of
this year and extends through December 31st).
Figure 3 – U.S. Dollar cumulative %
+(-) during June through December within bearish 8-year phase
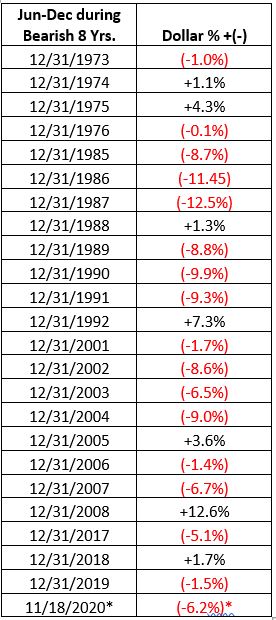
Figure 4 displays the year-by-year
results (i.e., the % gain/loss for the dollar during June through December ONLY
during those years when the 16-year cycle is bearish).
Figure 4 – U.S. Dollar % +(-) during
June through December within bearish 8-year phase
*- thru 11/18/20
Summary
There is absolutely nothing that
requires the U.S. dollar to adhere to the 16-year cycle detailed above. But history suggests that getting bearish during
the bullish 8-year phase and/or getting bullish during the bearish 8-year phase
typically involves being willing to “swim upstream.”
A large part of any investment
success is “identifying the flow” and “going with said flow.” The dollar will remain in a bearish phase
through March 2025. Therefore, history
suggests that June-Dec of 2021, 2022, 2023 and 2024 may be a time to consider a
bearish position re the buck.
See also Jay Kaeppel Interview in July 2020 issue of Technical Analysis of Stocks and Commodities magazine
Disclaimer: The information, opinions and ideas expressed herein are for
informational and educational purposes only and are based on research conducted
and presented solely by the author. The
information presented represents the views of the author only and does not
constitute a complete description of any investment service. In addition, nothing presented herein should
be construed as investment advice, as an advertisement or offering of investment
advisory services, or as an offer to sell or a solicitation to buy any
security. The data presented herein were
obtained from various third-party sources.
While the data is believed to be reliable, no representation is made as
to, and no responsibility, warranty or liability is accepted for the accuracy
or completeness of such information.
International investments are subject to additional risks such as
currency fluctuations, political instability and the potential for illiquid
markets. Past performance is no
guarantee of future results. There is
risk of loss in all trading. Back tested
performance does not represent actual performance and should not be interpreted
as an indication of such performance.
Also, back tested performance results have certain inherent limitations
and differs from actual performance because it is achieved with the benefit of
hindsight.
*”Every situation in life represents an opportunity”
*”Opportunity is where you find it”
Nowhere is this truer than in the
financial markets.
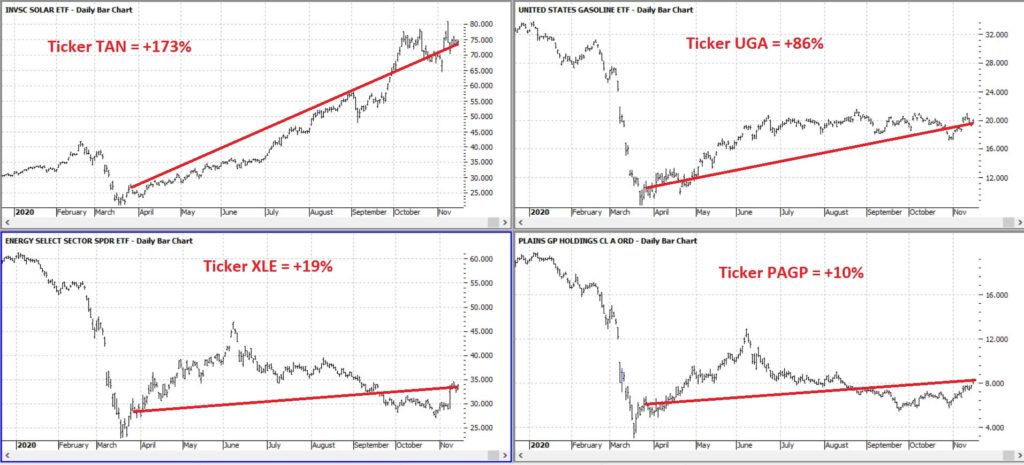
To wit, in this article dated 3/26/2020 (cue the scary music) – when things looked their absolute worst – I highlighted four tickers in the energy sector (yes, THAT energy sector, the one that has been a disaster and loathed and unloved for some time now). Now it would have taken a true “Buy when there is blood in the streets” mentality, and/or almost foolhardy nerves of steel to actually pile into those issues at the time.
But that is sort of the point.
Figure 1 displays the tickers and their price action since the close on 3/26/2020.
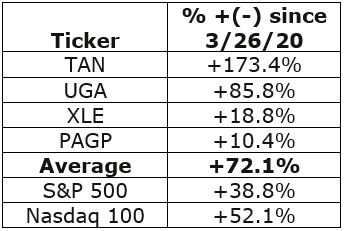
Figure 2 displays the comparative
performance versus the S&P 500 and the Nasdaq 100.
Figure 2 – “Blood in the Streets” energy stocks versus major indexes
As you can see in Figure 2 these four
stocks as a whole have actually outperformed both the S&P 500 Index and the
Nasdaq 100 Index.
Now the point IS NOT that I am some
great stock-picker (because I am not).
The point is that, well, see the two quotes above.
A Broader Look at Energy
For someone with less of the “buy when there is blood in the streets” mentality and more of “trend-following” mentality, a simple trend-following method may soon (at long last) swing to the bullish side.
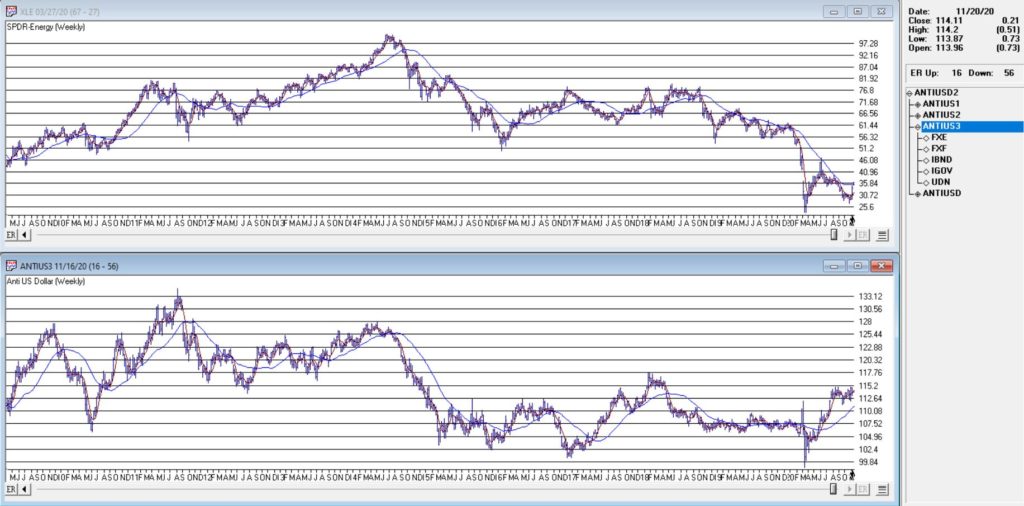
It works like this:
*Two “tickers” see their respective
5-week average cross above their respective 30-week average
*Ticker 1 is ticker XLE (the SPDR
energy ETF)
*Ticker 2 is an index (I created) of
securities that have an inverse correlation to the U.S. Dollar
You can see these two – along with
their respective 5-week and 30-week – in Figure 3.
As you can see in Figure 3 the two have a tendency to often move together. At other times they do not. The key point here is that we ONLY pay attention when the two tickers are both trending in the same direction.
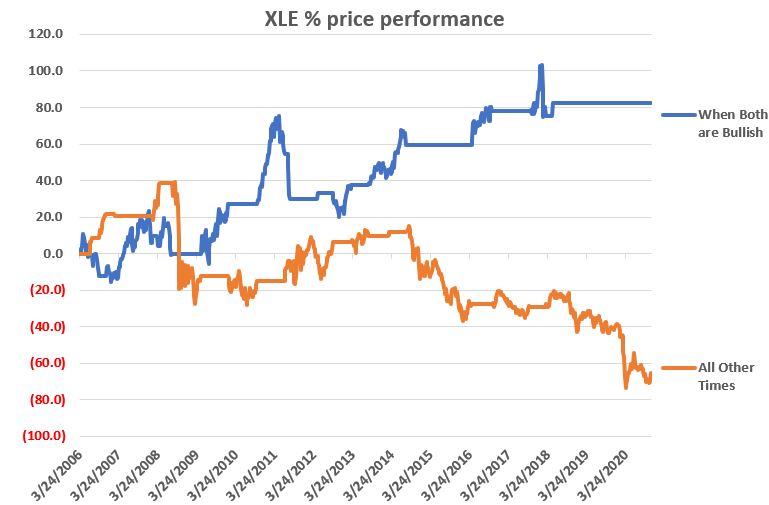
Why is this important?
Figure 4 displays the cumulative
price growth for ticker XLE (as a proxy for the broad energy sector) under two separate
circumstance:
*When BOTH XLE and ANTIUS3 are in
uptrends (i.e., 5-week average ABOVE 30-week average)
*When EITHER XLE or ANTIUS3 is NOT in
an uptrend (i.e., 5-week average BELOW 30-week average)
Figure 4 – XLE cumulative %+(-) depending
on trend status for XLE and ANTIUS3
To put it in numbers:
When BOTH are in Uptrends: XLE = +82.3%
When EITHER is NOT in an Uptrend: XLE
= -65.5%
Summary
Another glance at Figure 1 reveals
that ANTIUS3 is in an uptrend and that XLE is not quite there yet. So, at the moment there is no bullish signal
from the method described above. However,
energy does appear to be “trying” to rally.
Investors looking for “opportunity” may be wise to keep an eye on the 5-week
and 30-week averages of ticker XLE in the weeks and month ahead.
See also Jay Kaeppel Interview in July 2020 issue of Technical Analysis of Stocks and Commodities magazine
Disclaimer: The information, opinions and ideas expressed herein are for
informational and educational purposes only and are based on research conducted
and presented solely by the author. The
information presented represents the views of the author only and does not
constitute a complete description of any investment service. In addition, nothing presented herein should
be construed as investment advice, as an advertisement or offering of
investment advisory services, or as an offer to sell or a solicitation to buy
any security. The data presented herein
were obtained from various third-party sources.
While the data is believed to be reliable, no representation is made as
to, and no responsibility, warranty or liability is accepted for the accuracy
or completeness of such information.
International investments are subject to additional risks such as
currency fluctuations, political instability and the potential for illiquid
markets. Past performance is no
guarantee of future results. There is
risk of loss in all trading. Back tested
performance does not represent actual performance and should not be interpreted
as an indication of such performance.
Also, back tested performance results have certain inherent limitations
and differs from actual performance because it is achieved with the benefit of
hindsight.