Two of my favorite sayings go like this:
*”Every situation in life represents an opportunity”
*”Opportunity is where you find it”
Nowhere is this truer than in the financial markets.
To wit, in this article dated 3/26/2020 (cue the scary music) – when things looked their absolute worst – I highlighted four tickers in the energy sector (yes, THAT energy sector, the one that has been a disaster and loathed and unloved for some time now). Now it would have taken a true “Buy when there is blood in the streets” mentality, and/or almost foolhardy nerves of steel to actually pile into those issues at the time.
But that is sort of the point.
Figure 1 displays the tickers and their price action since the close on 3/26/2020.
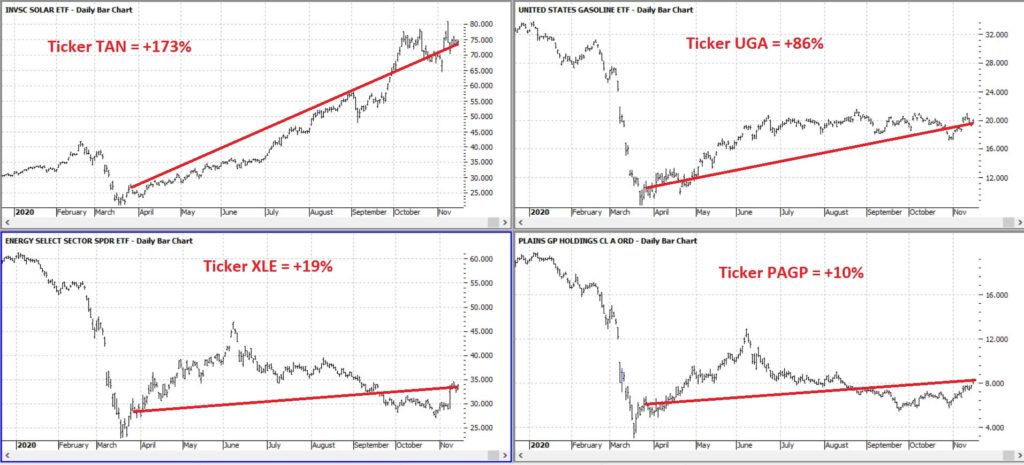
Figure 1 – Energy stocks highlighted in 3/26/20 (Courtesy ProfitSource by HUBB)
Figure 2 displays the comparative performance versus the S&P 500 and the Nasdaq 100.
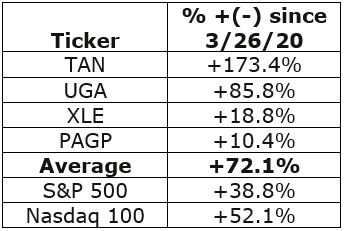
Figure 2 – “Blood in the Streets” energy stocks versus major indexes
As you can see in Figure 2 these four stocks as a whole have actually outperformed both the S&P 500 Index and the Nasdaq 100 Index.
Now the point IS NOT that I am some great stock-picker (because I am not). The point is that, well, see the two quotes above.
A Broader Look at Energy
For someone with less of the “buy when there is blood in the streets” mentality and more of “trend-following” mentality, a simple trend-following method may soon (at long last) swing to the bullish side.
It works like this:
*Two “tickers” see their respective 5-week average cross above their respective 30-week average
*Ticker 1 is ticker XLE (the SPDR energy ETF)
*Ticker 2 is an index (I created) of securities that have an inverse correlation to the U.S. Dollar
You can see these two – along with their respective 5-week and 30-week – in Figure 3.
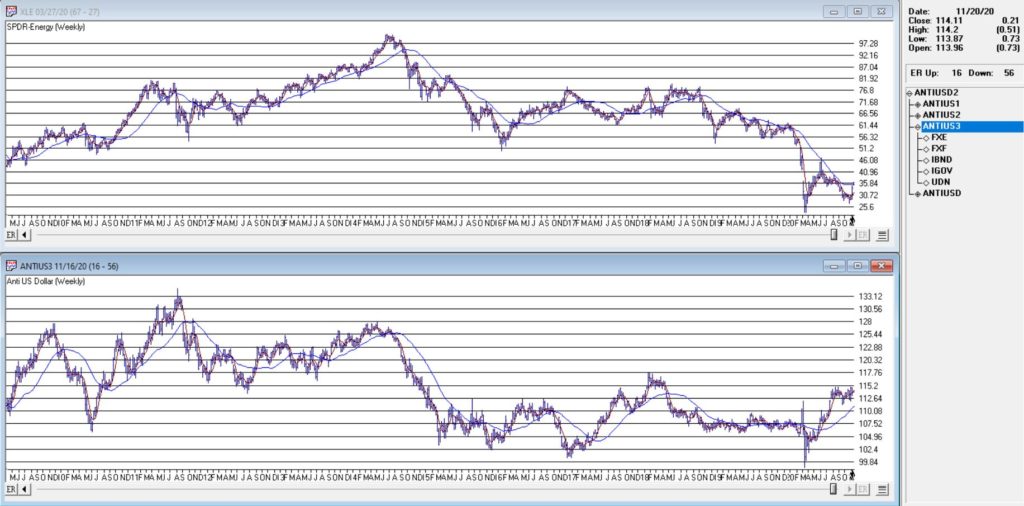
Figure 3 – Ticker XLE and Jay’s ANTIUS3 index w/5-week and 30-week averages (Courtesy AIQ TradingExpert)
As you can see in Figure 3 the two have a tendency to often move together. At other times they do not. The key point here is that we ONLY pay attention when the two tickers are both trending in the same direction.
Why is this important?
Figure 4 displays the cumulative price growth for ticker XLE (as a proxy for the broad energy sector) under two separate circumstance:
*When BOTH XLE and ANTIUS3 are in uptrends (i.e., 5-week average ABOVE 30-week average)
*When EITHER XLE or ANTIUS3 is NOT in an uptrend (i.e., 5-week average BELOW 30-week average)
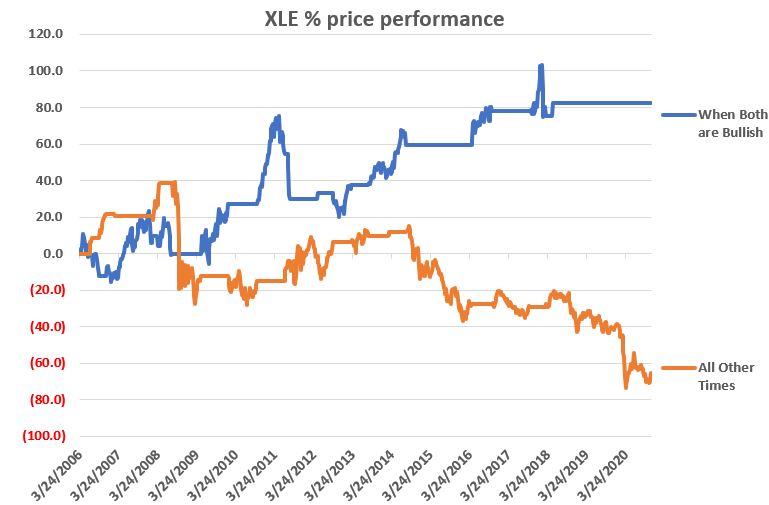
Figure 4 – XLE cumulative %+(-) depending on trend status for XLE and ANTIUS3
To put it in numbers:
When BOTH are in Uptrends: XLE = +82.3%
When EITHER is NOT in an Uptrend: XLE = -65.5%
Summary
Another glance at Figure 1 reveals that ANTIUS3 is in an uptrend and that XLE is not quite there yet. So, at the moment there is no bullish signal from the method described above. However, energy does appear to be “trying” to rally. Investors looking for “opportunity” may be wise to keep an eye on the 5-week and 30-week averages of ticker XLE in the weeks and month ahead.
See also Jay Kaeppel Interview in July 2020 issue of Technical Analysis of Stocks and Commodities magazine
See also Jay’s “A Strategy You Probably Haven’t Considered” Video
See also Video – The Long-Term…Now More Important Than Ever
Jay Kaeppel
Disclaimer: The information, opinions and ideas expressed herein are for informational and educational purposes only and are based on research conducted and presented solely by the author. The information presented represents the views of the author only and does not constitute a complete description of any investment service. In addition, nothing presented herein should be construed as investment advice, as an advertisement or offering of investment advisory services, or as an offer to sell or a solicitation to buy any security. The data presented herein were obtained from various third-party sources. While the data is believed to be reliable, no representation is made as to, and no responsibility, warranty or liability is accepted for the accuracy or completeness of such information. International investments are subject to additional risks such as currency fluctuations, political instability and the potential for illiquid markets. Past performance is no guarantee of future results. There is risk of loss in all trading. Back tested performance does not represent actual performance and should not be interpreted as an indication of such performance. Also, back tested performance results have certain inherent limitations and differs from actual performance because it is achieved with the benefit of hindsight.


It’s an interesting article, but what is it good for if the reader has no clue about your ANTIUS Index?
Eric, Fair question. The components of the index are displayed in the screen shot. The index is simply the average daily change for the 5 component ETFs (FXE, FXF, IBND, IGOV, UDN). Granted to follow it one would have to take the initiative to do the same. But remember, I don’t really sell anything here. I just tell you what I think and what I do. A super simplified version (although I have not tested it so can’t speak to exact results) would be to simply follow ticker UDN. Hope that helps. Jay