It is not exactly a little-known fact that the performance of small-cap stocks relative to large-cap stocks experiences something of an ebb and flow. It is also not exactly a secret that December into February has tended to see the market favor small-caps. I will explain why this is as soon as I come up with something plausible. Kidding. As a proud graduate of “The School of Whatever Works” I tend to spend less time focusing on “Why” and more time focusing on “When.”
The Small-Cap Sweet Spot
Our supposed “favorable period” for small-caps extends:
*From the close on December Trading Day #11 (12/15/20 this year) through the close of February Trading Day #11 (2/16/2021)
The Test
How has this worked out in the past? To test results, we will use the Russell 2000 (RUT) to measure small-cap performance and the Russell 1000 (RUI) to measure large-cap performance. Note that all results use price data only, NOT total return.
Figure 1 displays the cumulative % growth for both small-cap and large-cap ONLY during the Small-Cap Sweet Spot
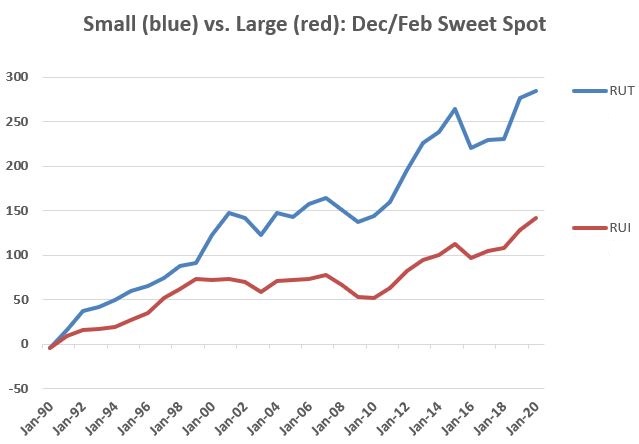
Figure 1 – Cumulative Seasonal Sweet Spot % + (-) for
The bottom line:
Small-Cap % +(-) = +284%
Large-Cap % +(-) = +142%
Now if I were smart, I would state something like “so clearly small-caps outperform large-caps during mid-Dec through mid-Feb!” and “The End.”
Unfortunately, I am not that smart.
Because the reality is that there is nothing “certain” about this relationship and as it turns out, even during a seemingly favorable for small-caps period there is still an “ebb and flow”. First some numbers.
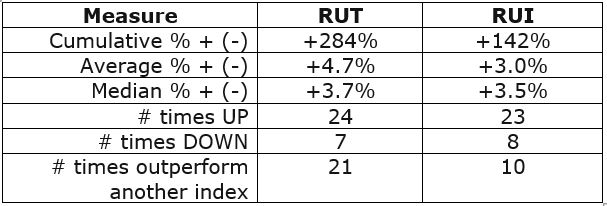
Figure 2 – Facts and Figures
Clearly small-caps have tended to outperform large caps during mid-Dec through mid-Feb. But there are a few caveats to keep in mind:
#1. There can and will be losing periods
RUT has lost money mid-Dec to mid-Feb in 7 of the last 31 years. While a 77%-win rate is outstanding in the financial markets, it also means that loses occurred 23% of the time. No one gets into small-caps in mid-December and gets out with a loss two months later and says, “Well, at least there is still a 77%-win rate!” They get out and say “Well that sucked” and shake their head wondering “what did I think that was a good idea?”
Which lends itself nicely to invoking….
Jay’s Trading Maxim #27: In the financial markets, the difference between theory and reality can occasionally be a chasm a mile wide.
#2. Losses can be relatively large
In 2003-2004 RUT lost -7.7% during the Sweet Spot and in 2016-2017 the loss was -12.0%. So, there’s that (you have officially been warned).
One piece of positive news, when it comes to double-digit gains and losses:
*# times RUT Sweet Spot gain > 10% = 8
*# times RUT Sweet Spot loss < -10% = 1
#3. RUT has underperformed RUI in four of the last five “Sweet Spots”
As I said, there is no “sure thing” here. For the record, there is a part of me that suspects that since things have “ebbed” in 4 of the last 5 years (i.e., small underperforming large), that a return to “flow” (i.e., small-caps outperforming) may be in the cards. Unfortunately, only time will tell.
Summary
Small-cap stocks have demonstrated a historical seasonal tendency to, a) advance in price, and, b) outperform large caps during the Seasonal Sweet Spot detailed above.
Whether or not it is worth attempting to exploit via an actual trade is left to the reader.
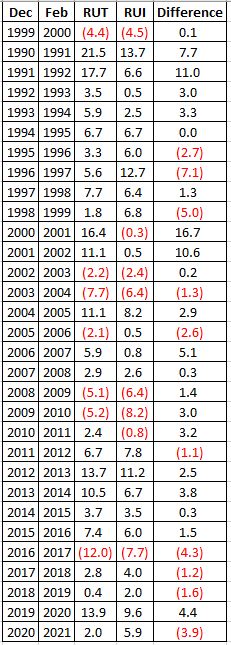
Figure 3 – Year-by-year results
See also Jay Kaeppel Interview in July 2020 issue of Technical Analysis of Stocks and Commodities magazine
See also Jay’s “A Strategy You Probably Haven’t Considered” Video
See also Video – The Long-Term…Now More Important Than Ever
Jay Kaeppel
Disclaimer: The information, opinions and ideas expressed herein are for informational and educational purposes only and are based on research conducted and presented solely by the author. The information presented represents the views of the author only and does not constitute a complete description of any investment service. In addition, nothing presented herein should be construed as investment advice, as an advertisement or offering of investment advisory services, or as an offer to sell or a solicitation to buy any security. The data presented herein were obtained from various third-party sources. While the data is believed to be reliable, no representation is made as to, and no responsibility, warranty or liability is accepted for the accuracy or completeness of such information. International investments are subject to additional risks such as currency fluctuations, political instability and the potential for illiquid markets. Past performance is no guarantee of future results. There is risk of loss in all trading. Back tested performance does not represent actual performance and should not be interpreted as an indication of such performance. Also, back tested performance results have certain inherent limitations and differs from actual performance because it is achieved with the benefit of hindsight.

