The U.S. Dollar has been in a pretty prolonged slump since spiking to a top in March of this year. Any chance for a rebound? Sure, there is always a chance. The buck is pretty oversold and trader sentiment – a typically contrarian indicator – is pretty darn negative. So, a “bounce” would not be entirely unexpected.
Still, the view from where I sit is that the dollar is in the midst of a longer-term decline.
The Long-Term Cycle
I read a number of years ago about a 16-year cycle for the U.S. dollar. Unfortunately, I can’t remember where I read it so I cannot give proper credit. I have read about this cycle again recently. For the record, it seems to follow the cycle with a slightly different start/end date than some sources I have seen recently. No matter. We are not talking about “precision market timing” here, just a basic overarching trend. So, let’s take a closer look.
The U.S. Dollar 16-Year Cycle
The first full 16-year cycle – by my account – began on 3/31/1969 (NOTE: the first date of data I have available is 1/31/1973 – so results below start in 1973). The “bearish” phase ran from then through 3/31/1977 and the “bullish” phase ran from 3/31/1977 through 3/31/1985. And so on and so forth. Figure 1 displays the cumulative % growth achieved by holding a hypothetical long position in the U.S. dollar during all bullish phases (blue line) and bearish phases (orange line).
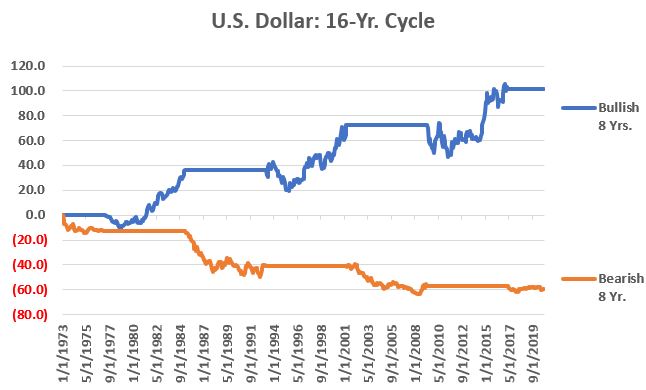
Figure 1 – Cumulative % +(-) for U.S. dollar during Bullish 8 year phases (blue) and Bearish 8 year phases (orange)
Figure 2 displays the results by the numbers.
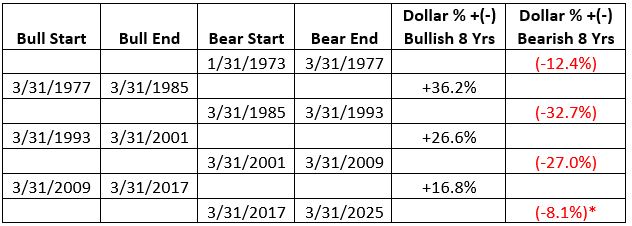
Figure 2 – U.S. Dollar during bull and bear phases of 16-year cycle (NOTE: 1st Bearish Phase began 3/31/1969, HOWOEVER, the 1st day of available data is 1/31/1973)
The latest phase – a bearish phase – began on 3/31/2017 and extends through 3/31/2025. Does that mean the dollar is doomed to decline relentlessly for another 4+ years? Not at all. It does tell us however, that it may be wise to favor the bearish side on any trade involving the U.S. dollar.
Digging a Little Deeper
Historically the most challenging time for the dollar is:
*During the months of June through December when the 16-year cycle is in a bearish phase
Figure 3 displays the cumulative % growth achieved by holding a hypothetical long position in the U.S. dollar ONLY during the months of June through December during those years when the 16-year cycle is bearish (the most recent such period began on June 1st of this year and extends through December 31st).
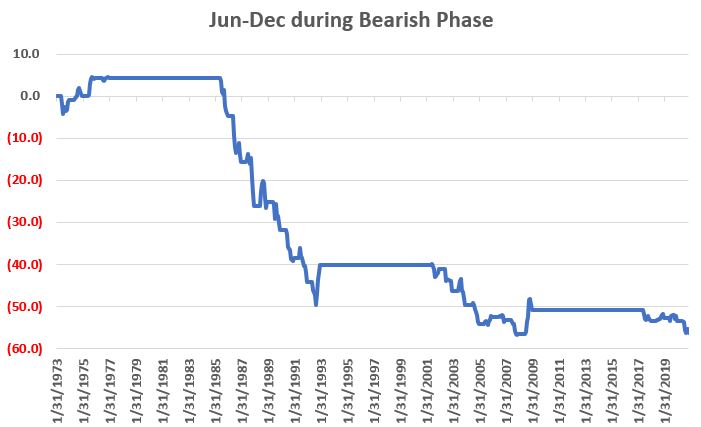
Figure 3 – U.S. Dollar cumulative % +(-) during June through December within bearish 8-year phase
Figure 4 displays the year-by-year results (i.e., the % gain/loss for the dollar during June through December ONLY during those years when the 16-year cycle is bearish).
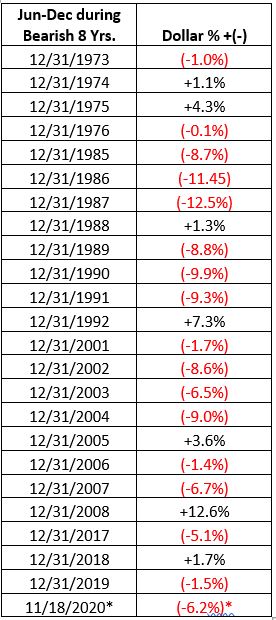
Figure 4 – U.S. Dollar % +(-) during June through December within bearish 8-year phase
*- thru 11/18/20
Summary
There is absolutely nothing that requires the U.S. dollar to adhere to the 16-year cycle detailed above. But history suggests that getting bearish during the bullish 8-year phase and/or getting bullish during the bearish 8-year phase typically involves being willing to “swim upstream.”
A large part of any investment success is “identifying the flow” and “going with said flow.” The dollar will remain in a bearish phase through March 2025. Therefore, history suggests that June-Dec of 2021, 2022, 2023 and 2024 may be a time to consider a bearish position re the buck.
See also Jay Kaeppel Interview in July 2020 issue of Technical Analysis of Stocks and Commodities magazine
See also Jay’s “A Strategy You Probably Haven’t Considered” Video
See also Video – The Long-Term…Now More Important Than Ever
Jay Kaeppel
Disclaimer: The information, opinions and ideas expressed herein are for informational and educational purposes only and are based on research conducted and presented solely by the author. The information presented represents the views of the author only and does not constitute a complete description of any investment service. In addition, nothing presented herein should be construed as investment advice, as an advertisement or offering of investment advisory services, or as an offer to sell or a solicitation to buy any security. The data presented herein were obtained from various third-party sources. While the data is believed to be reliable, no representation is made as to, and no responsibility, warranty or liability is accepted for the accuracy or completeness of such information. International investments are subject to additional risks such as currency fluctuations, political instability and the potential for illiquid markets. Past performance is no guarantee of future results. There is risk of loss in all trading. Back tested performance does not represent actual performance and should not be interpreted as an indication of such performance. Also, back tested performance results have certain inherent limitations and differs from actual performance because it is achieved with the benefit of hindsight.

