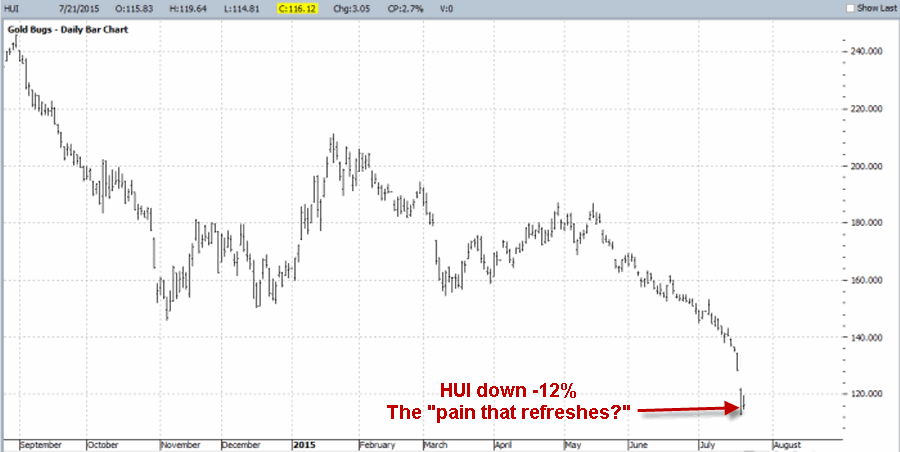
Well here I go again breaking one of my own cardinal rules again – i.e., being critical of someone else’s writing. Must be getting cranky in my old age. Anyway, I recently read an article calling margin debt “an indicator that predicts nothing.” No the writer is actually technically correct for the most part. Still this sort of surprised me as I remember learning from Norman Fosback’s 1975 classic “Stock Market Logic” that margin debt was a very useful indicator. As with a lot of things it depends on how you look at it.
The author in the unnamed article accurately notes the fact that many other analysts are warning that “record margin debt” is a red flag or warning sign. He also rightly points out that margin debt has been making new highs for several years now with no adverse affect on the stock market. And up to this point I agree. In fact, he is correct that there is no bearish implication to high and/or rising margin debt. Well, at least up to a point. However, as Fosback taught, it is not so much the “level” of margin debt that matters as it is the “trend.”
A Trading Method Using Margin Debt and Credit Balances in Margin Accounts
There are some technical (read “extremely boring”) explanations that have to be made regarding the data used in this test (DO NOT STOP READING!!!!) If necessary, just skip the boring nitty gritty for now and skip ahead. You have my permission).
The data comes from this site: http://www.nyxdata.com/nysedata/asp/factbook/viewer_edition.asp?mode=table&key=3153&category=8
*I am using two sets of data:
1) Margin Debt
2) Credit balances in margin accounts
*There is no data listed for credit balances in margin accounts for the entire year of 1966. December 1965 lists a value of $1,666 and January 1967 lists a value of $640. So for lack of a better method I simply took the difference and divided by 13 to get $78.92 and subtracted that value from the running total for each month in 1966 (i.e., December 1965 = $1,666, January 1966 = $1,587.08, February 1966 = $1508.16, etc.).
*I calculate a 12-month moving average for margin debt. If the current month’s reading is above the 12-month moving average the indicator is considered bullish and vice versa.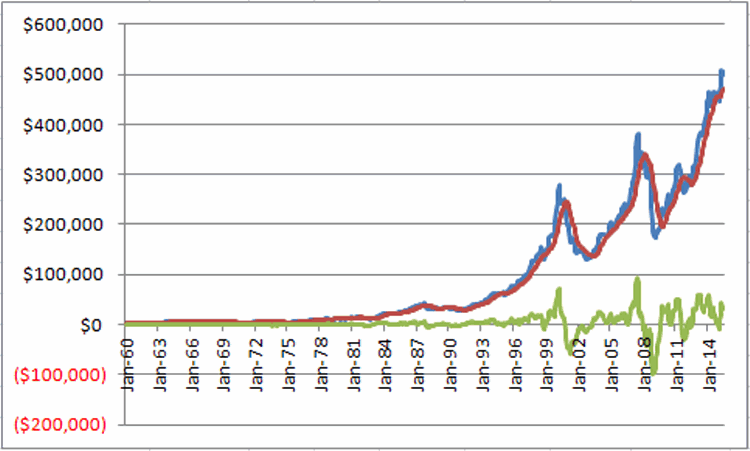 Figure 1 – Monthly Margin Debt versus 12-month moving average
*I calculate a 12-month moving average for free credit balances in margin accounts. If the current month’s reading is above the 12-month moving average the indicator is considered bullish and vice versa.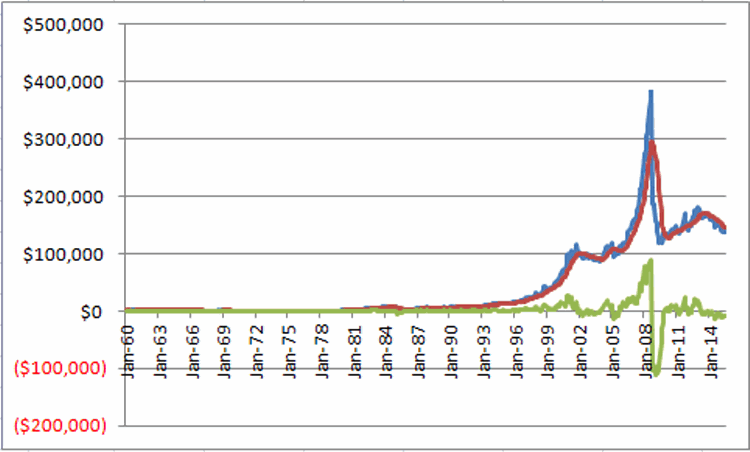 Figure 2 – Monthly Free Credit Balances in Margin Accounts versus 12-month moving average
*The data for a given month is released sometime during the following month (I am not sure if it is uniform from month to month in terms of release date). So to analyze actual market performance based on indicator readings I created (for lack of a more creative name – Jay’s Margin/Credit Balance Index – that gets updated at the end of the month:
*At the end of the month, if the margin debt value for the previous month (which was released some time during the current month) is above the 12-month average of monthly margin debt readings, the Model gets +1 point (for example if June data is released on July 15th and the latest reading is above the 12-month average then at the close on July 31st the Index gets +1 point added for the month of August).
*At the end of the month, if the free credit balances in margin account for the previous month (which was released some time during the current month) is above the 12-month average of monthly free credit balances in margin accounts, the Model gets +1 point (for example if June data is released on July 15th and the latest reading is above the 12-month average then at the close on July 31st the Index gets +1 point added for the month of August).
*So at the end of each month Jay’s Margin/Credit Balance Index will read 0, +1 or +2.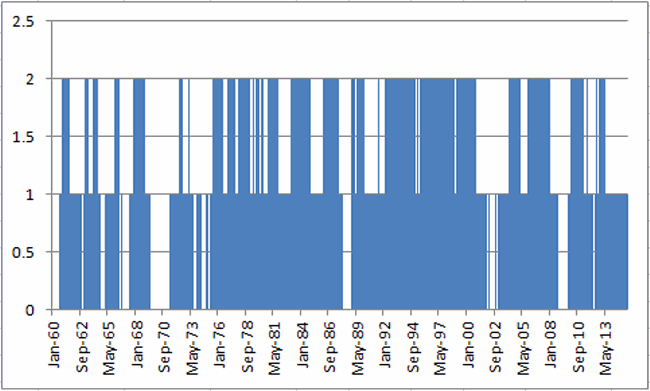 Figure 3 – Jay’s Margin/Credit Balance Index (Dec 1959-July 2015)
As you can see, sometimes both measures are favorable (+2 readings), sometimes only one is favorable (+1 readings) and sometimes neither are favorable (0 readings).
Does any of this matter? Consider the following:
| Jay’s Margin/Credit Balance Index |
Index = 0 |
Index > 0 |
| # Months |
100 |
566 |
| # Months Up |
50 (50%) |
336 (59.4%) |
| # Months Down |
50 (50%) |
230 (40.6%) |
| Average Mthly % +(-) |
+0.0004% |
+0.0068% |
| Median Mthly % +(-) |
(-0.0002%) |
+0.0083% |
| $1,000 invested in DJIA |
$908 |
$28,561 |
| Cumulative % Return |
(-9.2%) |
+2,756% |
Summary
So it is correct to say that “record margin debt” predicts nothing and that fretting and worrying about it is pointless. However, this also sort of misses the main point – i.e., it is the “trend” that matters and not the “level”. Rising margin debt almost invariably accompanies a bull market. But as Yin follow Yang (at least according to people who say things like that), “all good things gotta come to an end.” And so too will the favorable reading from Jay’s Margin/Credit Balance Index (FYI, margin debt is presently in an uptrend and credit balances are not so the Index stands at +1 and will remain so through at least the end of August).
In the meantime just remember that the difference between +2,756% (the gain for the Dow when Jay’s Margin/Credit Index > 0) and -9.2% (the loss for the Dow when Jay’s Margin/Credit Index = 0) is what we “quantitative types” refer to as “statistically significant.”
Bottom Line: Enjoy the ride….because it won’t last forever.
Jay Kaeppel
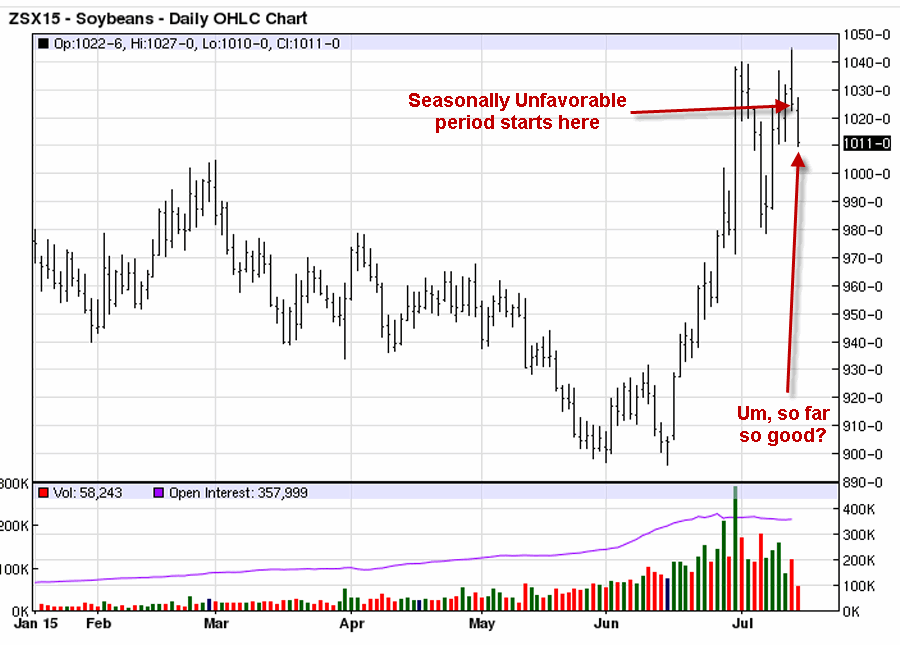
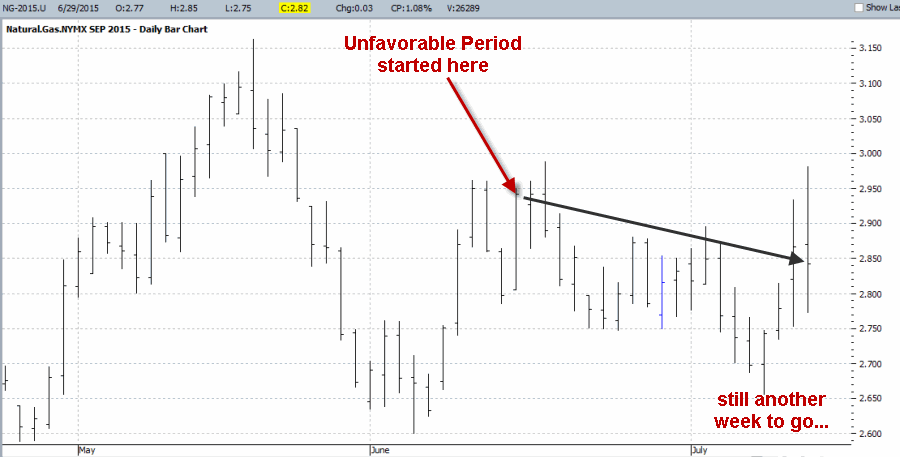
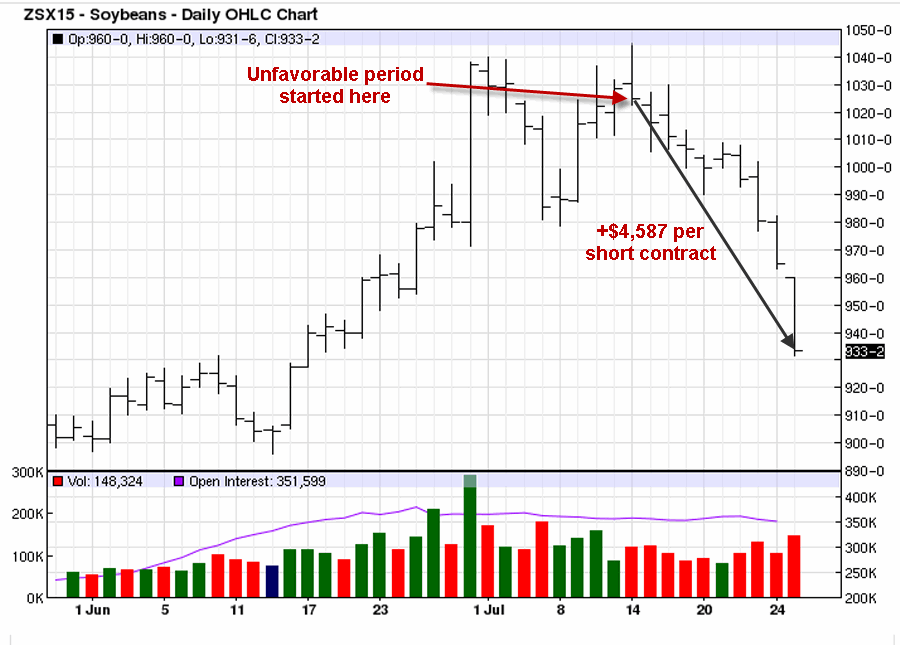 Figure 1 – Unfavorable Seasonal period for Soybeans looking, um, unfavorable indeed (Courtesy: www.Barchart.com)