In a couple of recent articles (here and here) I wrote about natural gas and crude oil. Now seems like an exceptionally good time for an update. In Update #1, I discussed natural gas. Now let’s look at crude oil.
Crude Oil
In the initial article, I highlighted the fact that as of mid-May the daily and weekly Elliott Wave counts for crude oil were projecting sharply lower prices. While I did not necessarily trust the magnitude of the projected price move, I made the argument that there is nothing wrong with a speculator “risking a couple of bucks” once in awhile.
So the example trade I detailed in the article involved trading put options on ticker USO, an ETF that ostensibly tracks the price of crude oil. The trading in the original article was:
*Buying USO Aug 15 put @ $0.14
In the original article I listed a 10-lot, but just to make it interesting let’s assume that a trader was willing to commit $1,000 to the trade. In that case the trade could have bought 70 Aug 15 puts for a total risk of $980.
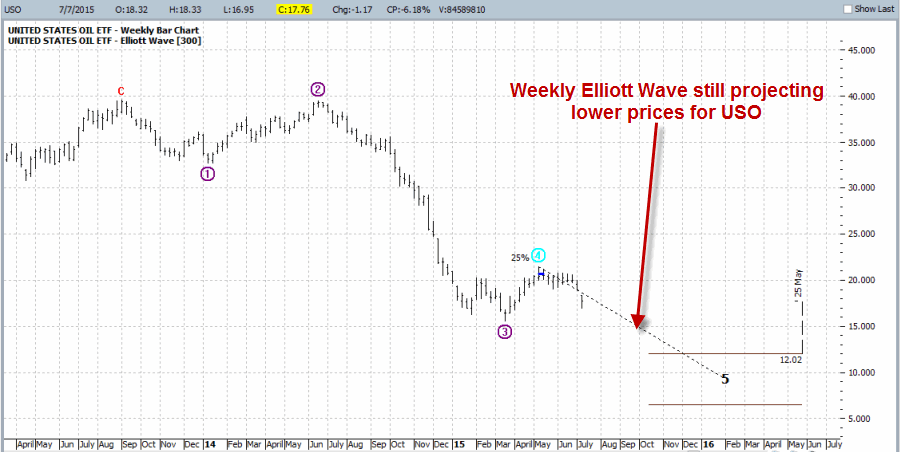
As you can see in Figure 1, USO has declined sharply and the Weekly Elliott Wave count is still projecting significantly lower prices (although for the record, the daily count is NOT).
 Figure 1 – Weekly Elliott Wave count for ticker USO still pointing lower (Courtesy: www.ProfitSource.com)
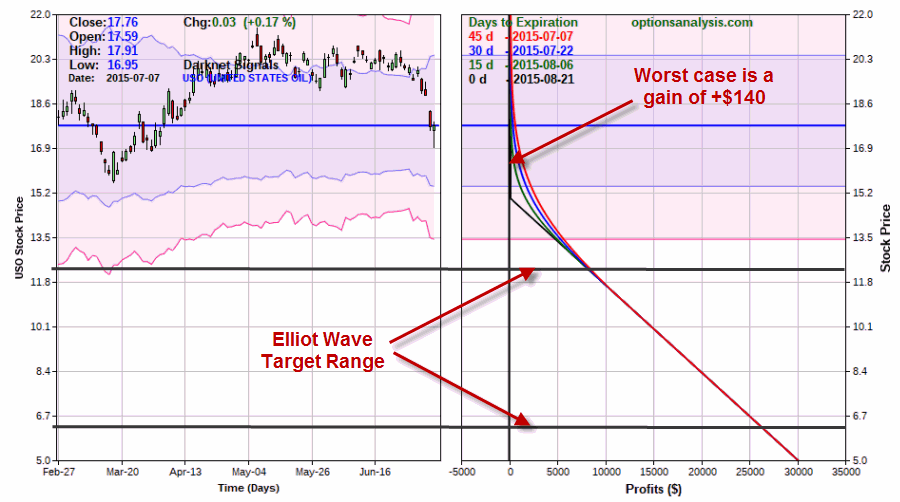
On 7/6 USO closed at $17.73. During the day on 7/7, USO traded as low as $16.95 – which created the opportunity to sell part of the position at a double – then rallied to close at $17.76. As you can see in Figure 3 below, in the early plunge experienced by USO on 7/7, this option registered a “double” (i.e., hit a price of $0.28).
So let’s assume the following. The trader:
1) Sold 40 of his original 70-lot at $0.28
2) Continues to hold the remaining 30-lot
The current status of the trade appears in Figure 2 and 3. Figure 2 – USO Aug 15 puts (Courtesy www.OptionsAnalysis.com)
 Figure 3 – USO Aug 15 puts (Courtesy www.OptionsAnalysis.com)
The current situation is this:
*The ProfitSource Weekly Elliott Wave count is projecting a target price of $12.02 to $6.50 for USO.
*The worst thing that can happen with this trade is that USO closes above $15 a share at August expiration, in which case this trade will have a profit of $140 (on a $980 investment).
*If by some chance USO does hit $12.02 a share prior to August option expiration this trade will show a profit in the $8,000 range.
OK, two important mitigating factors to consider:
1) The Weekly Elliott Wave count is projecting this price range to be hit sometime between October of 2015 and May of 2016, meanwhile;
2) We are holding an August put options
So is it realistic to expect to make $8,000 by August option expiration? My own answer: Very highly unlikely. Still, we are now sitting with a “free position” with 45 days left until expiration. Two choices at the moment are:
A) Let it ride for a while
B) Exit this position and roll out to a further out expiration month.
Summary
As I mentioned in the previous “Energetic” article, there are no right or wrong answers. So the following is nothing more than one man’s position: the original purpose of the trade was simply to “take a shot” that crude would decline in price based on nothing more than daily and weekly Elliott Wave counts that were in bearish agreement. To “roll out” now (i.e., to sell the August puts and buy puts in a further out expiration month would cost money and increase risk. At this point I (personally) would be more inclined to let the current risk free August position “ride” for a little while.
As August expiration nears a trader can reassess things, but for now I would simply sit back and hope for the best (or in the case of crude oil, the worst) in the near future secure in the knowledge that this trade cannot lose money (thanks to selling 40 of the 70 put options purchased originally).
Jay Kaeppel

