In Part 1 I detailed the 40-Week Cycle and the 212-Week Cycle and spelled out specific rules for designating each of these cycles as “Bullish” or not.
For the 40-Week Cycle since 9/14/1962:
*The Dow gained +3,219% during “bullish” phases (+4,255 if 1% of annual interest is earned while out of the market)
*The Dow lost -12% during “non bullish” phases for the 40-Week Cycle
For the 212-Week Cycle since 7/24/1950:
*For all trading days for the Dow Industrials since 7/24/1950 the average daily % gain is +0.00031% (or +8% annualized).
*During the “bullish” phase of the 212-week cycle since 7/24/1950 the average daily % gain for the Dow Industrials is +0.00095% (or +27% annualized)
Now let’s look at market performance when we combine these two cycles.
Jay’s “Cycle System”
*If 40-Week Cycle is “Bullish”* then Cycle Model adds +1
*If 212-Week Cycle is “Bullish”** then Cycle Model adds +1
For any given day Cycle Model can read 0, +1 or +2
*40-Week Cycle starts a new bullish phase every 280 calendar days. The next bullish phase starts at the close of 8/7/2015. A bullish phase lasts 140 calendar days or until the Dow loses -12.5 on a closing basis from its price at the lose of the cycle start date.
**212-Week Cycle starts a new bullish phase every 1484 calendar days (no, seriously) and the bullish phase last for 6 months. the next 212-week bullish phase starts at the close of 7/27/2015.
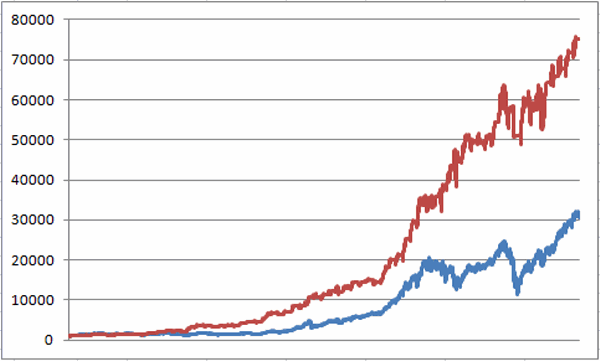
Figure 1 displays the growth of $1,000 invested in the Dow only when the Cycle Model = 0 from 10/1/62 through 7/10/15. Figure 1 – Growth of $1,000 holding Dow Industrials only when Cycle Model is equal to 0 (10/1/62-7/10/15)
Now let’s look at the other extreme, i.e., when both cycles are bullish at the same time (i.e., when the Cycle Model is equal to +2). Figure 2 – Growth of $1,000 holding Dow Industrials only when Cycle Model is equal to +2 (10/1/62-7/10/15)
Notice a difference between Figures 1 and 2? (If not, may I suggest you consider a professional money manager to handle your affairs.)
Creating a Cycle Model System
So let’s take what we have so far and create an actual trading “system” with actual trading rules:
Rule #1. If the Cycle Model is greater than 0 (i.e., if EITHER the 40-week or 212-week cycles are “bullish” then hold the Dow Indutrials.
Rule #2. If the Cycle Model is equal to 0 then hold cash (this test assume 1% of interest per year).
The results for this “system” starting on 10/1/62 versus buy-and-hold appears in Figure 3. Figure 6 – Growth of $1,000 holding Dow Industrials only when Cycle Model is equal to +1 or +2 (red line) versus Buy-and-Hold (blue line); (10/1/62-7/10/15)
Results of Note (since 10/1/1962):
*Cycle Model = 0; Dow lost (-48%)
*Cycle Model > 0; Dow gained +5,833%
*If we add 1% of annual interest when out of the market, the Cycle System gained +7,426% versus +3,005% for buying-and-holding the Dow.
*The maximum drawdown for the Cycle System was -23.5%
*The maximum drawdown for buy-and-hold was -53.8%
Upcoming Cycle System Readings
*7/13/15 through 7/27/15 = 0
*7/27/15 through 8/7/15 = +1 (Bullish)
*8/7/15 through 12/24/15 = +2 (Bullish)
*12/24/15 through 1/27/16 = +1 (Bullish)
*after 1/27/16 = 0
Summary
As I am wont to say, the difference between +7,426% and -48% is what we “quantitative analyst” types refer to as “statistically significant.” That being said, does it really make sense for investors to throw away all other forms of analysis and rely solely on two (OK, let’s jut go ahead and say it out loud – “somewhat arcane” – ) cycles to decide when to be in or out of the stock market? Probably not.
Still, it seems like a good time to invoke the school mantra from my alma mater, “The School of Whatever Works” – that being:
“Hey, whatever works.”
Jay Kaeppel


2 thoughts on “Beating the Market with Two Simple Cycles (Part 2)”
Comments are closed.