Nothing like a simple concept. So, when it comes to silver, it turns out that the best forecaster of the future trend in the price of silver is, well, the price trend of silver. Too simple? Let’s take a look.
Silver
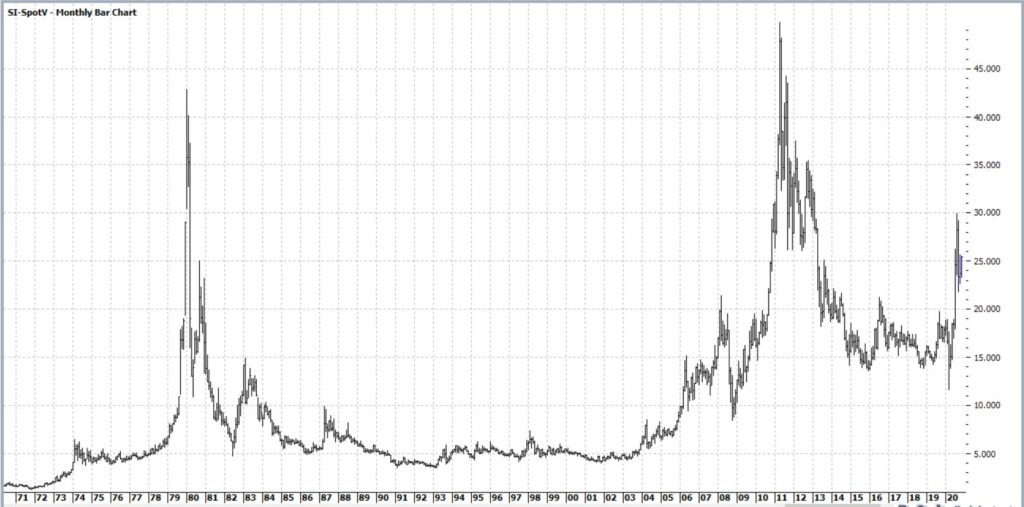
Figure 1 displays the monthly chart of silver futures going back to 1970. Let’s just say, “a lot has happened”.

Figure 1 – Silver futures (Courtesy ProfitSource by HUBB)
But here is the interesting thing. Let’s look at the hypothetical results achieved by buying and holding a silver futures contract if:
*Silver is UP over the past 52 weeks
*Silver is DOWN over the past 52 weeks
Specifically, at the end of each week we will determine whether silver is higher or lower than it was 52 weeks prior.
*The blue line in Figure 2 displays the cumulative $ +(-) achieved if one held a silver futures contract ONLY when the prior 52 weeks shows a rise in the price of silver
*The orange line in Figure 2 displays the cumulative $ +(-) achieved if one held a silver futures contract ONLY when the prior 52 weeks shows a decline in the price of silver

Figure 2 – Holding a long position in silver if previous 52-week were UP (blue line) or down (orange line)
The blue line is by no means a “straight line” advance – there is a lot of “swooping and soaring” involved. But the key point is the stark difference between the two lines. To wit:
*+(-) from holding silver is 52 week ROC>0 = +$199,690
*+(-) from holding silver is 52 week ROC<=0 = (-$89,525)
Summary
This is not intended to be an “automatic” bullish or bearish signal for silver. But in terms of “weight of the evidence” it is clearly appears to be better to “go with the trend” when it comes to silver.
When things are swell, things are great – and when they’re not, get it off your plate.
For the record, silver is up roughly 30% over the last 52 weeks.
See also Jay Kaeppel Interview in July 2020 issue of Technical Analysis of Stocks and Commodities magazine
See also Jay’s “A Strategy You Probably Haven’t Considered” Video
See also Video – The Long-Term…Now More Important Than Ever
Jay Kaeppel
Disclaimer: The information, opinions and ideas expressed herein are for informational and educational purposes only and are based on research conducted and presented solely by the author. The information presented represents the views of the author only and does not constitute a complete description of any investment service. In addition, nothing presented herein should be construed as investment advice, as an advertisement or offering of investment advisory services, or as an offer to sell or a solicitation to buy any security. The data presented herein were obtained from various third-party sources. While the data is believed to be reliable, no representation is made as to, and no responsibility, warranty or liability is accepted for the accuracy or completeness of such information. International investments are subject to additional risks such as currency fluctuations, political instability and the potential for illiquid markets. Past performance is no guarantee of future results. There is risk of loss in all trading. Back tested performance does not represent actual performance and should not be interpreted as an indication of such performance. Also, back tested performance results have certain inherent limitations and differs from actual performance because it is achieved with the benefit of hindsight.


Is this based on the 5000 ounce contract?
Yes