Ticker ZROZ is the PIMCO 25+ Year Zero Coupon U.S. Treasury Index (do not attempt to say that 3 times fast) ETF. It tracks an index of zero-coupon treasury securities with an effective duration of 20+ years.
Now let’s interpret that into English.
A zero-coupon bond is a bond that pays no interest. Instead it sells at a discount to face value ($1,000) to create a specific rate of return if held until maturity.
Wait, I though you said this was going to be in English.
An example: For a standard interest paying bond you might pay $900 to buy the bond and get paid x% of interest every year for y number of years and then be paid $1,000 at maturity. With a zero-coupon bond of the same duration you might pay only $800 to buy the bond. No interest is paid along the way but you still receive the $1,000 at maturity.
Because no interest is paid along the way, zero coupon bonds are extremely sensitive to changes in interest rates. This does not technically matter if you are planning to hold it until maturity. However, there can be large price fluctuations along the way depending on much time is left until maturity and how large the interest rate swings are along the way.
The present effective yield-to-maturity for a 20-year zero-coupon treasury is somewhere around or slightly below the 2% range. So, if interest rates were to rise in the interim, the value of a 20-year zero coupon bond is likely to get hit hard (granted it will eventually work its way back to $1,000 of face value, still I am not a fan of locking in sub 2% return for 20 years).
So why am I bothering to discuss zero-coupon bonds? Well, there is a time for everything.
Zeroes and the Election Cycle
Many are familiar with the stock market and the apparent impact of the 4-year election cycle. Turns out the stock market is not alone. For testing purposes, we will use the Merrill Lynch Treasury Strips 20+ Year Index to measure the performance of zero-coupon bonds across the 48-month election cycle. The data starts in April 1995.
Figure 1 displays the months during the election cycle that favor 20-year zeroes.
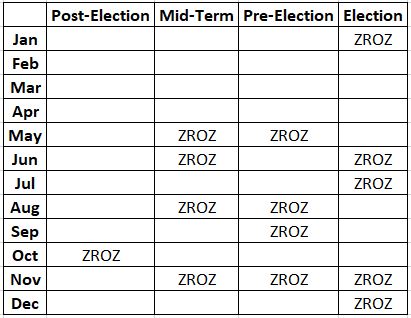
Figure 1 – ZROZ Election Cycle Calendar
Figure 2 displays the cumulative % growth for the index ONLY during the months listed in Figure 1.
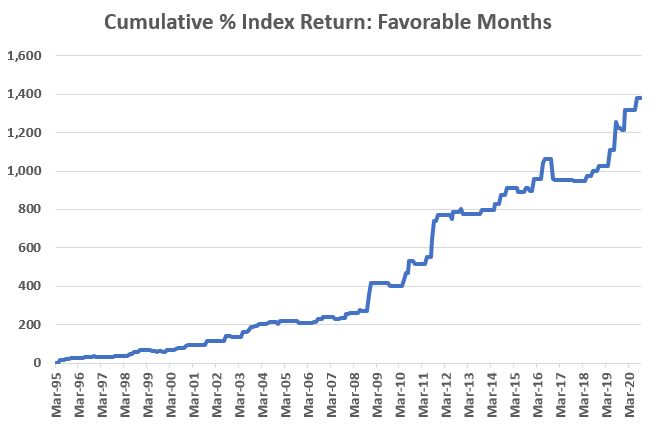
Figure 2 – Cumulative % +(-) Merrill Lynch Treasury Strips 20+ Year Index gain ONLY during Favorable Election Cycle Months
To better appreciate the performance displayed in Figure 2, Figure 3 displays the cumulative % return for the index ONLY during all months NOT LISTED in Figure 1.
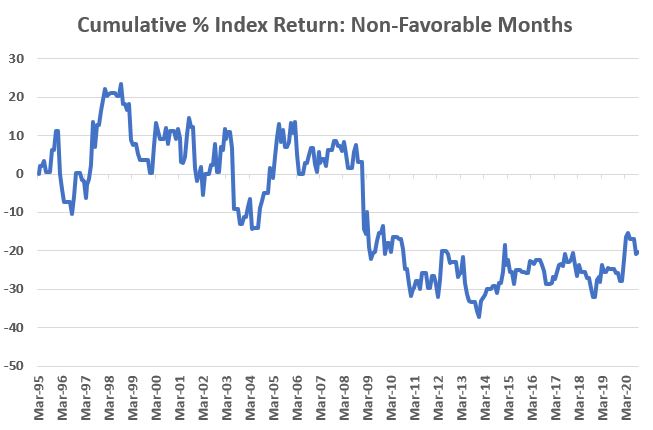
Figure 3 – Cumulative % +(-) Merrill Lynch Treasury Strips 20+ Year Index gain ONLY during all Non-Favorable Election Cycle Months
ZROZ and the Election Cycle
The first full month of total return data for ticker ZROZ is November 2009.
*The blue line in Figure 4 displays % return for ZROZ held ONLY during the months listed in Figure 1.
*The orange line in Figure 4 displays the % return for ZROZ held only during all months NOT LISTED in Figure 1.
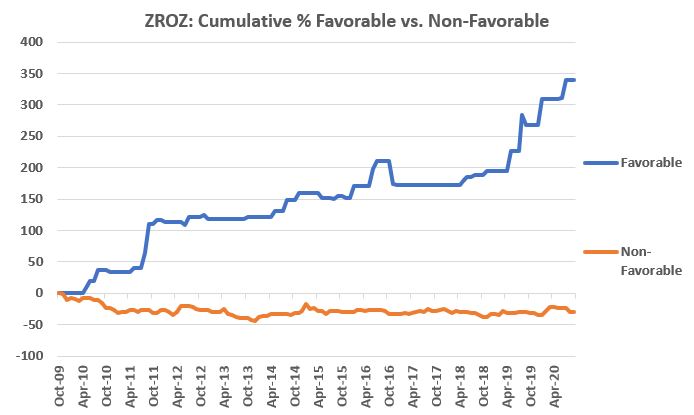
Figure 4 – Cumulative % +(-) for ticker ZROZ during “Favorable” Election Cycle Months (blue) and during “Non-favorable” Election cycle Months (orange)
The next “favorable” election cycle months for ZROZ are November and December of 2020.
Summary
Does any of the above suggest that ZROZ is “guaranteed” to gain ground during November and December? Not at all. In fact, one can certainly question the entire concept of relying on “election cycle months” to actually invest money.
But that’s up to each individual to decide. For now, we are in the “information is (or at least, may be) power” stage. Now you know that some months appear to better than others for zero-coupon bonds.
Seriously though, who knew?
See also Jay Kaeppel Interview in July 2020 issue of Technical Analysis of Stocks and Commodities magazine
See also Jay’s “A Strategy You Probably Haven’t Considered” Video
See also Video – The Long-Term…Now More Important Than Ever
Jay Kaeppel
Disclaimer: The information, opinions and ideas expressed herein are for informational and educational purposes only and are based on research conducted and presented solely by the author. The information presented represents the views of the author only and does not constitute a complete description of any investment service. In addition, nothing presented herein should be construed as investment advice, as an advertisement or offering of investment advisory services, or as an offer to sell or a solicitation to buy any security. The data presented herein were obtained from various third-party sources. While the data is believed to be reliable, no representation is made as to, and no responsibility, warranty or liability is accepted for the accuracy or completeness of such information. International investments are subject to additional risks such as currency fluctuations, political instability and the potential for illiquid markets. Past performance is no guarantee of future results. There is risk of loss in all trading. Back tested performance does not represent actual performance and should not be interpreted as an indication of such performance. Also, back tested performance results have certain inherent limitations and differs from actual performance because it is achieved with the benefit of hindsight.

