One of the keys to trading success is to put as many factors in your favor as possible when identifying a trading opportunity. The other key is to understand that “this time around” those factors may not mean a hill of beans so you had better allocate your capital – and manage your risk – wisely.
A relevant potential case in point is found in the soybean market.
The Factors: Seasonality
Figure 1 displays the annual seasonal trend for soybeans. Focus on the action of the blue line contained in the red box.
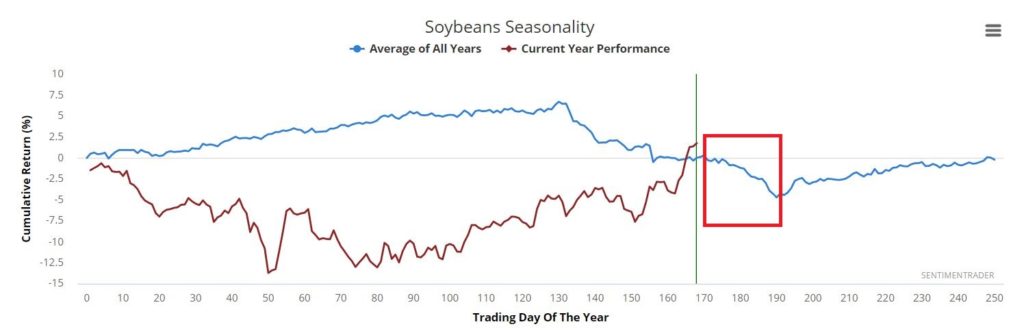
Figure 1 – Soybeans seasonal annual trend (Courtesy Sentimentrader.com)
The period contained in the box roughly equates to September Trading Day #5 through October Trading Day #2. We’ll focus on this period more closely in a moment, but for now just note that seasonality is suggesting an edge to the bears during this period.
The Factors: Sentiment
Figure 2 displays the Soybeans Optix for the past 10 years. As you can see at the far right, the current Optix value is just touching what would be considered the upper end (i.e., overly bullish sentiment). By itself this should NOT be interpreted as a “Sell Now!!” signal. However, as part of the overall “weight of the evidence” it is fair to add it to the “potentially negative” side of the ledger.
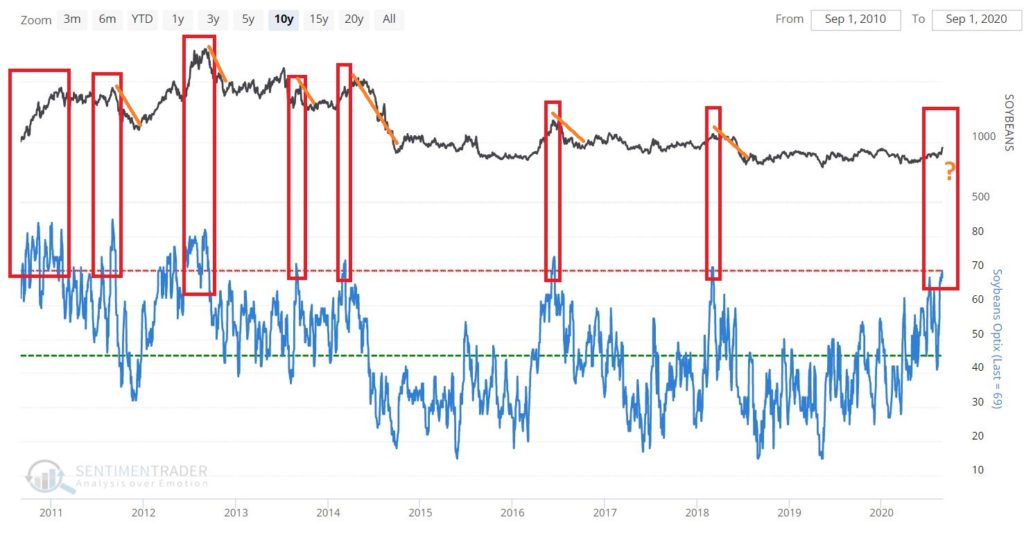
Figure 2 – Soybeans Optix (Courtesy Sentimentrader.com)
The Factors: Hedgers Positions
Like sentiment, the current state of “hedgers positions” on a standalone basis is not flashing any kind of a definitive signal. However, it is toward the lower end of the range following a significant decline in the indicator in the lower clip. As you can see in Figure 3, previous significant declines in soybean hedger positions toward roughly a 1-year low have often been followed by weakness in soybean prices.
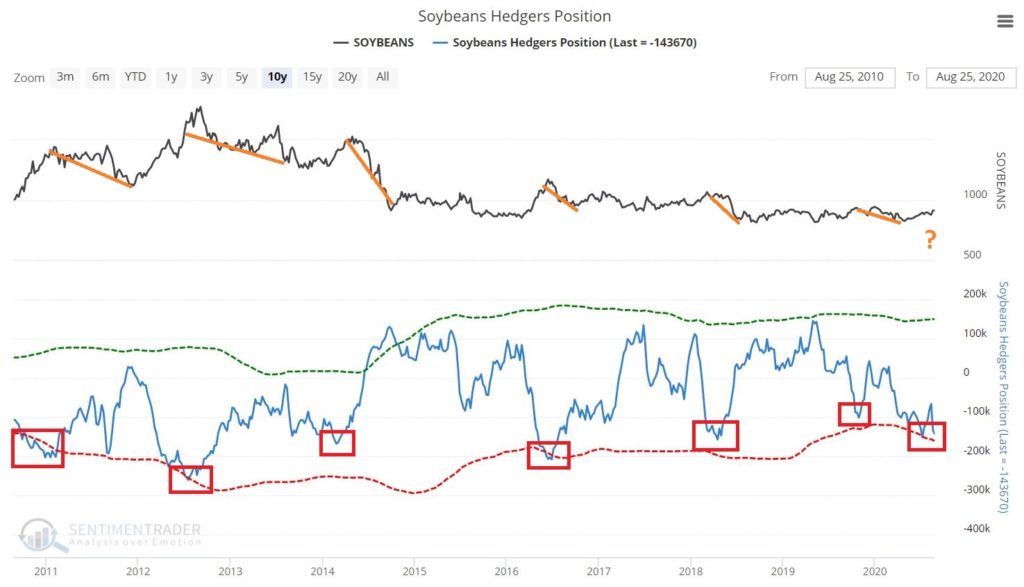
Figure 3 – Soybeans Hedgers Positions (Courtesy Sentimentrader.com)
From a Traders Perspective
What follows IS NOT a “recommended” trade. It is simply an example of how a trader might approach this situation, taking this opportunity into account in terms of:
*Probability
*Capital allocation
*Risk control
If we look a little more closely, we find that the period that extends from the close on September Trading Day #5 through October Trading Day #2 has been unfavorable for beans over the year. How unfavorable?
Figure 4 displays the cumulative dollar return from holding a short position in soybeans futures during only this period every year starting in 1975. A price of 950 for soybean futures equates to $9.50 for a bushel of soybeans. Each 1 “point” move is worth $50, so a trader who sells beans at 950 and buys back at 900 earns 50 points times $50 a point, or a gain of +$2.500.
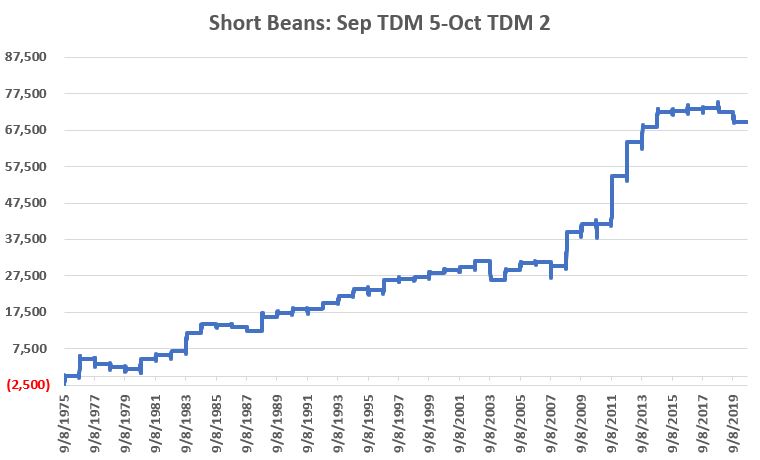
Figure 4 – Soybeans cumulative hypothetical $ +/- holding a short futures position from September Trading Day #5 through October Trading Day #2
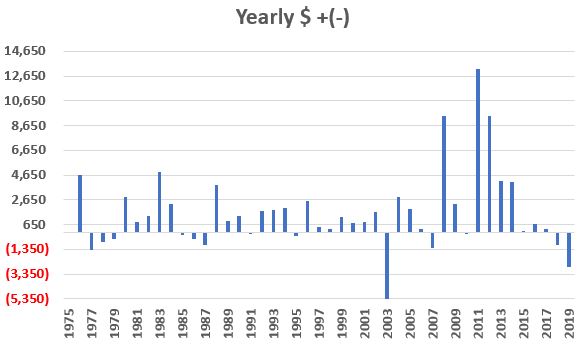
Figure 5 displays the yearly $ +(-) hypothetical $ +/- holding a short futures position from September Trading Day #5 through October Trading Day #2
Things to Note:
*32 years showed a gain (71%)
*13 years showed a loss (29%)
*Average winning trade = +$2,663
*Average losing trade = (-$1,184)
*Win/Loss Ratio = 2.46 (71%/29%)
*Ave. Win/Ave. Loss = 2.25 ($2,663/$1,184)
Clearly this trend offers possibilities on a “probability” basis.
The real questions for an actual trader are “how much $ to commit?” and “how much risk is involved?”
Considering Drawdowns
Figure 6 displays the annual +/- from holding a short position in soybean futures for the full period along with the worst open loss experienced along the way.
| Year | $ +(-) | Worst Open $ Loss |
| 1975 | $13 | ($2,425) |
| 1976 | $4,625 | ($475) |
| 1977 | ($1,425) | ($2,250) |
| 1978 | ($775) | ($1,575) |
| 1979 | ($488) | ($1,375) |
| 1980 | $2,850 | ($1,163) |
| 1981 | $850 | ($575) |
| 1982 | $1,325 | ($938) |
| 1983 | $4,913 | ($1,038) |
| 1984 | $2,338 | ($75) |
| 1985 | ($238) | ($1,050) |
| 1986 | ($513) | ($650) |
| 1987 | ($1,038) | ($1,200) |
| 1988 | $3,825 | $0 |
| 1989 | $913 | $0 |
| 1990 | $1,300 | ($450) |
| 1991 | ($88) | ($1,550) |
| 1992 | $1,725 | $0 |
| 1993 | $1,850 | ($338) |
| 1994 | $1,988 | ($225) |
| 1995 | ($263) | ($1,650) |
| 1996 | $2,588 | ($1,038) |
| 1997 | $475 | ($488) |
| 1998 | $325 | ($600) |
| 1999 | $1,250 | ($375) |
| 2000 | $800 | ($50) |
| 2001 | $850 | ($600) |
| 2002 | $1,675 | ($888) |
| 2003 | ($5,350) | ($5,350) |
| 2004 | $2,913 | $0 |
| 2005 | $1,900 | $0 |
| 2006 | $275 | ($500) |
| 2007 | ($1,288) | ($4,550) |
| 2008 | $9,400 | ($650) |
| 2009 | $2,300 | ($1,300) |
| 2010 | ($138) | ($3,875) |
| 2011 | $13,200 | ($450) |
| 2012 | $9,400 | ($1,450) |
| 2013 | $4,150 | ($1,950) |
| 2014 | $4,125 | $0 |
| 2015 | $100 | ($788) |
| 2016 | $700 | ($613) |
| 2017 | $275 | ($1,188) |
| 2018 | ($1,025) | ($1,025) |
| 2019 | ($2,763) | ($3,025) |
Figure 6 – Annual hypothetical +/- and largest open loss during life of trade; 1975-2019
To read Figure 6, in 1975 the short trade registered a net gain of $12.50 (rounded to $13 in the Table). The worst open loss during the life of the trade was -$2,425. In other words, you had to sit through an open loss of -$2,425 in order to garner the $12.50 profit. As you can see, these numbers can vary widely from year to year.
Now let’s get down to the nitty-gritty of capital allocation. First off, there are no hard and fast rules, so we will simply highlight one common sense approach.
The worst recorded drawdown for any one trade was $5,350 in 2003. As I write, the margin requirement to sell short 1 soybean futures contract at the Chicago Board of Trade is $4,725.
*So, one simple approach would be to add these two values together ($5,350 + $4,725 = $10,075). Using this simple approach, a trader would allocate capital of $10,075 to sell short 1 soybean futures contract.
*IMPORTANT NOTE: A short position in a futures contract entails unlimited risk. So a trader should also consider a stop loss order. There is no “magic number” but for sake of example, let’s assume we want to put a stop-loss beyond the largest previous loss of -$5.350. If we will risk a maximum of $5,400 then we divide $5,400 by $50 and get 108 soybean “points”. So if we sell short a soybean futures contract trading at a quoted price of 965 (or $9.65 a bushel), we might place a stop-loss to buy back the contract at 1,073.
What Kind of Return?
For sake of example, let’s assume that every year a Trader allocates $10,075 and sells short 1 soybean futures contract at the close on the 5th trading day of September and then buys it back to close the short position at the close on the 2nd trading day of October.
Figure 7 displays the hypothetical annual results in terms of “% return on capital allocated” and “largest open loss as a % of allocated capital.”
| Year | % Return | Largest % Open loss |
| 1975 | 0.1% | (24.1%) |
| 1976 | 45.9% | (4.7%) |
| 1977 | (14.1%) | (22.3%) |
| 1978 | (7.7%) | (15.6%) |
| 1979 | (4.8%) | (13.6%) |
| 1980 | 28.3% | (11.5%) |
| 1981 | 8.4% | (5.7%) |
| 1982 | 13.2% | (9.3%) |
| 1983 | 48.8% | (10.3%) |
| 1984 | 23.2% | (0.7%) |
| 1985 | (2.4%) | (10.4%) |
| 1986 | (5.1%) | (6.5%) |
| 1987 | (10.3%) | (11.9%) |
| 1988 | 38.0% | 0.0 |
| 1989 | 9.1% | 0.0 |
| 1990 | 12.9% | (4.5%) |
| 1991 | (0.9%) | (15.4%) |
| 1992 | 17.1% | 0.0 |
| 1993 | 18.4% | (3.3%) |
| 1994 | 19.7% | (2.2%) |
| 1995 | (2.6%) | (16.4%) |
| 1996 | 25.7% | (10.3%) |
| 1997 | 4.7% | (4.8%) |
| 1998 | 3.2% | (6.0%) |
| 1999 | 12.4% | (3.7%) |
| 2000 | 7.9% | (0.5%) |
| 2001 | 8.4% | (6.0%) |
| 2002 | 16.6% | (8.8%) |
| 2003 | (53.1%) | (53.1%) |
| 2004 | 28.9% | 0.0 |
| 2005 | 18.9% | 0.0 |
| 2006 | 2.7% | (5.0%) |
| 2007 | (12.8%) | (45.2%) |
| 2008 | 93.3% | (6.5%) |
| 2009 | 22.8% | (12.9%) |
| 2010 | (1.4%) | (38.5%) |
| 2011 | 131.0% | (4.5%) |
| 2012 | 93.3% | (14.4%) |
| 2013 | 41.2% | (19.4%) |
| 2014 | 40.9% | 0.0 |
| 2015 | 1.0% | (7.8%) |
| 2016 | 6.9% | (6.1%) |
| 2017 | 2.7% | (11.8%) |
| 2018 | (10.2%) | (10.2%) |
| 2019 | (27.4%) | (30.0%) |
| Average | +15.4% | (-11.0%) |
Figure 7 – % returns and risks
Summary
Will soybeans decline between the close on 9/8/2020 and 10/2/2020? It beats me. This seasonal trade has been a loser each of the last two years and seasonality overall has not been great in 2020.
Still history clearly suggests a negative bias. When we add in sentiment and hedgers positioning, the odds seem to favor a the downside. In the end – and as always – the real questions are “how much money do you have to commit” and “is it worth the risk” in your opinion.
See also Jay Kaeppel Interview in July 2020 issue of Technical Analysis of Stocks and Commodities magazine
See also Jay’s “A Strategy You Probably Haven’t Considered” Video
See also Video – The Long-Term…Now More Important Than Ever
Jay Kaeppel
Disclaimer: The information, opinions and ideas expressed herein are for informational and educational purposes only and are based on research conducted and presented solely by the author. The information presented represents the views of the author only and does not constitute a complete description of any investment service. In addition, nothing presented herein should be construed as investment advice, as an advertisement or offering of investment advisory services, or as an offer to sell or a solicitation to buy any security. The data presented herein were obtained from various third-party sources. While the data is believed to be reliable, no representation is made as to, and no responsibility, warranty or liability is accepted for the accuracy or completeness of such information. International investments are subject to additional risks such as currency fluctuations, political instability and the potential for illiquid markets. Past performance is no guarantee of future results. There is risk of loss in all trading. Back tested performance does not represent actual performance and should not be interpreted as an indication of such performance. Also, back tested performance results have certain inherent limitations and differs from actual performance because it is achieved with the benefit of hindsight.

