2020 has been “quite a year” (That’s my “Understatement of the Year”, hope you enjoyed it). A shocking sell-off early in the year, followed by an equally shocking (for most people, but not everyone) rally ever since. I haven’t been writing much lately because, well, what’s to say? The stock market goes up…and up…and up… and, well, you get the picture. It has mostly just been “sit back and enjoy the ride” time.
But of course, questions arise. Questions like “will this last forever?” And “if not, then how much longer.” My answers are “No”, and “It beats me.” But we can look to the past for a couple of potential clues.
The Next Two Months
Over the years, the September-October period has witnessed a great deal of volatility – and more than its fair share of downside price action. That is not to imply that that will necessarily be the case this time around. Still, to get a better picture, we will trace the S&P 500 Index back to 1928, in order to get a longer perspective.
Figure 1 tracks the price gain or loss (not total return) for the S&P 500 Index ONLY during September and October of every presidential election year starting in 1928.
| Year | S&P 500 Sep-Oct % during Election Years |
| 1928 | +3.9% |
| 1932 | (-17.0%) |
| 1936 | +7.6% |
| 1940 | +4.9% |
| 1944 | (-0.3%) |
| 1948 | +3.6% |
| 1952 | (-2.0%) |
| 1956 | (-4.1%) |
| 1960 | (-6.3%) |
| 1964 | +3.7% |
| 1968 | +4.6% |
| 1972 | +0.4% |
| 1976 | (-0.0%) |
| 1980 | +4.2% |
| 1984 | (-0.4%) |
| 1988 | +6.7% |
| 1992 | +1.1% |
| 1996 | +8.2% |
| 2000 | (-5.8%) |
| 2004 | +2.4% |
| 2008 | (-24.5%) |
| 2012 | +0.4% |
| 2016 | (-2.1%) |
Figure 1 – % price return for S&P 500 Index held only during September-October of each election year since 1928 (Source: www.Macretrends.com)
The key things to note regarding the 23 September-October election year periods measured:
*13 showed a gain, 10 showed a loss
*The average performance was a loss of (-0.47%)
*The best performance was a gain was +8.2 (1996)
*The worst performance was loss of -24.5% (2008)
Figure 2 displays the cumulative % price gain or loss for the S&P 500 Index ONLY during Sep-Oct of election years.
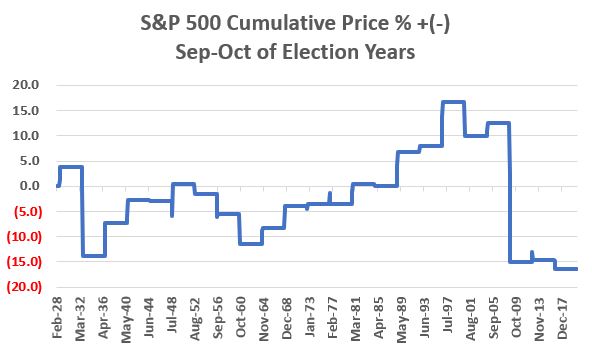
Figure 2 – Cumulative price % gain/loss for S&P 500 Index held only during September and October of each presidential election year since 1928
As you can see, there’s been some hits, there’s been some misses, and there has been a couple of “major whacks” (1932 and 2008). The bottom line? Anything can happen in the next two months. If you are the type to “hedge”, now would probably be about as good a time as any. But remember, I am talking about “hedging” and NOT “Oh My God Sell Everything The Sky is Falling!” (although as you can see in Figure 2, that is technically one of the possibilities).
The Next Seven Months
One of the best kept secrets in the market is the long-term outperformance by the S&P 400 MidCap Index during the months of November through May versus other major indexes (sssshhhh!!!). The 2019-2020 was clearly a painful exception to the rule as the MidCap Index took a significant hit during the Covid-19 selloff in February and March. But investors need to recognize that nothing is “perfect” in the stock market and that even the most persistent trends can deviate greatly (and painfully) from time to time. The next bullish “Sell in May” period begins on November 1st. Let’s take a closer look at the performance of the S&P 400 MidCap Index for November through May Power Zone periods that begin during a presidential election year.
The S&P 400 Index first came into existence in early 1981, which was a post-election year. So, for that year we will use only January 1981 through May 1981 to measure performance. Starting with the next election year -1984 – and for each subsequent four-year election cycle, we will measure performance for the full November (election year) through May (post-election year) period. Figure 3 displays the total return for the S&P 400 MidCap Index for each election year/post-election year Power Zone since 1981.
| November thru May Election Yr/Post-Election Yr | S&P 400 MidCap Total Return % |
| 1980-1981 | +12.7% |
| 1984-1985 | +20.5% |
| 1988-1989 | +23.5% |
| 1992-1993 | +14.8% |
| 1996-1997 | +16.2% |
| 2000-2001 | +0.9% |
| 2004-2005 | +12.0% |
| 2008-2009 | +2.5% |
| 2012-2013 | +21.9% |
| 2016-2017 | +15.1% |
| 2020-2021 | ? |
Figure 3 – % total return for S&P 400 MidCap Index held only during November of each election year through the end of May of the subsequent post-election year; 1981-2020
The key things to note regarding the 10 Power Zone periods measured:
*All 10 instances (100%) showed a gain
*The average gain was +14.0%
*The largest gain was +23.5% (1988-1989)
*The smallest gain was +0.9% (2000-2001)
Figure 4 displays the cumulative % total return for the S&P 400 MidCap Index ONLY during Nov-May periods that start during an election year.
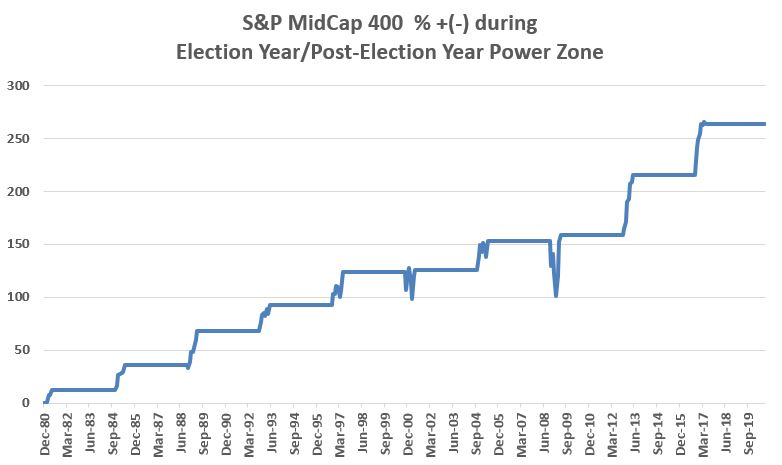
Figure 4 – Cumulative % total return for S&P 400 MidCap Index held only during November of each election year through May of the subsequent post-election year; 1981-2020
Summary
The next two months are anyone’s guess. But following that, history suggest that we should probably not be surprised if the market continues to show strength in the 1st half of 2021.
See also Jay Kaeppel Interview in July 2020 issue of Technical Analysis of Stocks and Commodities magazine
See also Jay’s “A Strategy You Probably Haven’t Considered” Video
See also Video – The Long-Term…Now More Important Than Ever
Jay Kaeppel
Disclaimer: The information, opinions and ideas expressed herein are for informational and educational purposes only and are based on research conducted and presented solely by the author. The information presented represents the views of the author only and does not constitute a complete description of any investment service. In addition, nothing presented herein should be construed as investment advice, as an advertisement or offering of investment advisory services, or as an offer to sell or a solicitation to buy any security. The data presented herein were obtained from various third-party sources. While the data is believed to be reliable, no representation is made as to, and no responsibility, warranty or liability is accepted for the accuracy or completeness of such information. International investments are subject to additional risks such as currency fluctuations, political instability and the potential for illiquid markets. Past performance is no guarantee of future results. There is risk of loss in all trading. Back tested performance does not represent actual performance and should not be interpreted as an indication of such performance. Also, back tested performance results have certain inherent limitations and differs from actual performance because it is achieved with the benefit of hindsight.

