I am fond of saying that the primary key to investment and trading success is finding an “edge” and exploiting it repeatedly. I don’t know, sounds reasonable. But what constitutes an “edge”? Well, one definition that comes to mind is “some tidbit of information that leads to consistent profits”. So, what I will highlight here is simply that – a tidbit of information. It is probably not enough to go on as a standalone approach. And it comes around very infrequently (only 5 times every four years), and won’t come up again until 2021. So, chances are you will forget all about this by then. But hey, that’s not my problem, I’m just the “idea guy.”
See also Jay Kaeppel Interview in July 2020 issue of Technical Analysis of Stocks and Commodities magazine
The Big 5 Months
For the record, The Big 5 Months came about from a lot of work that I have done analyzing the four-year election cycle. For the sake of brevity, I’ll not be getting into the “how this came about” part, just the “here’s what it is” part.
The Big 5 Months is comprised of the following months within the four-year election cycle.
*April of the Post-Election Year
*December of the Post-Election Year
*November of the Mid-Term Election Year
*April of the Pre-Election Year
*December of the Pre-Election Year
To help visualize this calendar, see Figure 1.
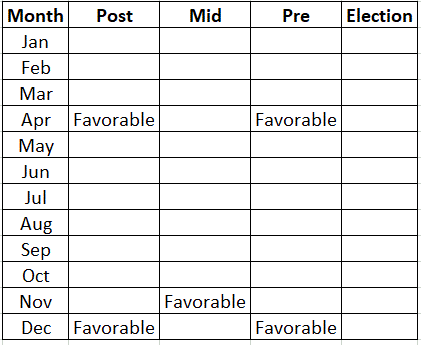
Figure 1 – The Big 5 Months Calendar
Unfortunately, there are no months within the actual Presidential Election year that qualify. Why do these months matter? First note that results are measured from January 1901 through May 2020 using month-end price data for the Dow Jones Industrial Average. December of 2020 will mark the end of the 30th election cycle during that time period. Through May of 2020 this comes to a total of 1432 months. The Big 5 Months comprise only 150 total months, or 10.5% of all months.
So again, what’s the big deal amount these months? In my best Maxwell Smart voice let me say “Would you believe?” then I would ask you to consider the results displayed in Figure 2.
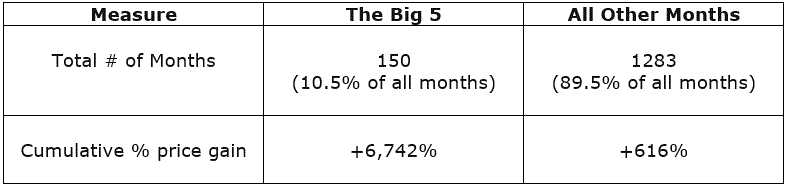
Figure 2 – Results: Big 5 Months versus All Other Months; 1901-May 2020
To put this into context consider that:
*Although The Big 5 Months comprised only 10.5% of all months in the past 119+ years of trading, within those months the Dow registered 10.9 times as much gain as during the other 89.5% of months.
Figure 3 displays the cumulative % price performance for the Dow during “The Big 5” months versus “All Other Months.”
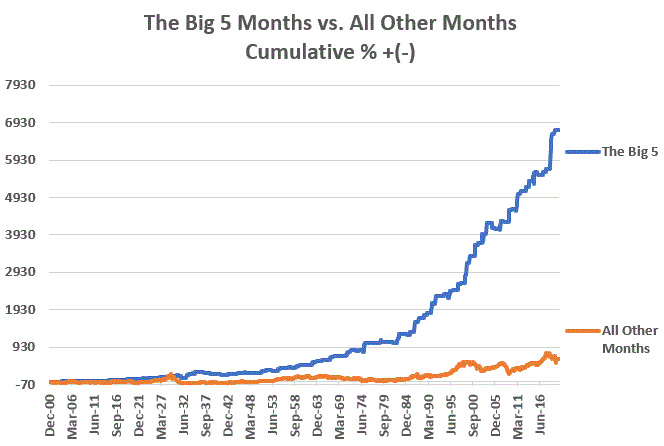
Figure 3 – Cumulative price performance %: The Big 5 Months versus All Other Months; 1901-May 2020
Drilling Down
Taken individually the results for each of The Big 5 Months is decent but not exactly jaw-dropping. See Figure 4.
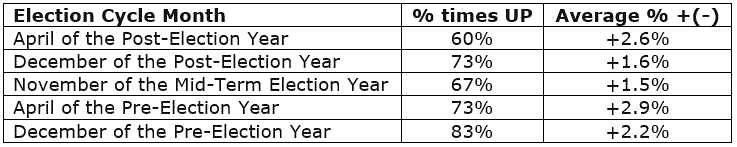
Figure 4 – The Big 5 performance by Month; 1901-May 2020
When taken collectively however, the results are fairly impressive:
*Holding the Dow only during The Big 5 Months every four years registered a gain during 28 of the 30 election cycles, or 93% of the time
*Holding the Dow only during All Other Months every four years (through May 2020) registered a gain during 19 of the 30 election cycles, or 63% of the time
*Holding the Dow only during The Big 5 Months every four years outperformed holding the Dow during the other 43 months every four years 18 out of 30 times**
**there are still seven months to complete during 30th election cycle ending December 2020. But so far, from January 2017 through May 2020, The Big 5 Months have gained +21.7% versus +5.6% for All Other Months.
Summary
Opportunity is where you find it. Do The Big 5 Months constitute an opportunity? That’s not for me to say. Will anyone remember this come April of 2021? Will April of 2021 even see the Dow register a gain?
Dunno. But remember, opportunity is where you find it.
See also Jay Kaeppel Interview in July 2020 issue of Technical Analysis of Stocks and Commodities magazine
See also Jay’s “A Strategy You Probably Haven’t Considered” Video
See also Video – The Long-Term…Now More Important Than Ever
Jay Kaeppel
Disclaimer: The information, opinions and ideas expressed herein are for informational and educational purposes only and are based on research conducted and presented solely by the author. The information presented represents the views of the author only and does not constitute a complete description of any investment service. In addition, nothing presented herein should be construed as investment advice, as an advertisement or offering of investment advisory services, or as an offer to sell or a solicitation to buy any security. The data presented herein were obtained from various third-party sources. While the data is believed to be reliable, no representation is made as to, and no responsibility, warranty or liability is accepted for the accuracy or completeness of such information. International investments are subject to additional risks such as currency fluctuations, political instability and the potential for illiquid markets. Past performance is no guarantee of future results. There is risk of loss in all trading. Back tested performance does not represent actual performance and should not be interpreted as an indication of such performance. Also, back tested performance results have certain inherent limitations and differs from actual performance because it is achieved with the benefit of hindsight.

