The information contained in this piece is not presented as a “strategy” but rather as an “idea.” Essentially a starting point if you will, for developing a method to exploit certain seasonal trends that the stock market has exhibited over a number of years.
See also Jay Kaeppel Interview in July 2020 issue of Technical Analysis of Stocks and Commodities magazine
The Indexes
*S&P 500 Index (large-cap)
*MSCI EAFE Index (International)
*S&P 400 Index (mid-cap)
*Nasdaq 100** (OTC stocks)
*FTSE NAREIT All Equity Index (Real Estate Investment Trusts)
**I have monthly total return data for the Nasdaq 100 (ticker NDX) starting in April 1996; so, prior to that date the Nasdaq Composite (ticker COMPQ) is used
Test Period
January 1981 through May 2020. The start date of Jan 1981 was chosen because that is the first month of data available for the S&P 400 Index, so in order to compare apples-to-apples testing on all indexes are started then.
The Seasonal Periods
Each index has exhibited its own somewhat unique seasonal tendencies over the years. So, it is correct to point out that the seasonal periods used for each index is chosen with the benefit of hindsight and that, yes, “past performance does not guarantee future results.” With that caveat in mind, the periods that each index is held appears in Figure 1

Figure 1 – Favorable Seasonal Periods by Index
Results

Figure 2 – Index % total return during Favorable versus Unfavorable periods
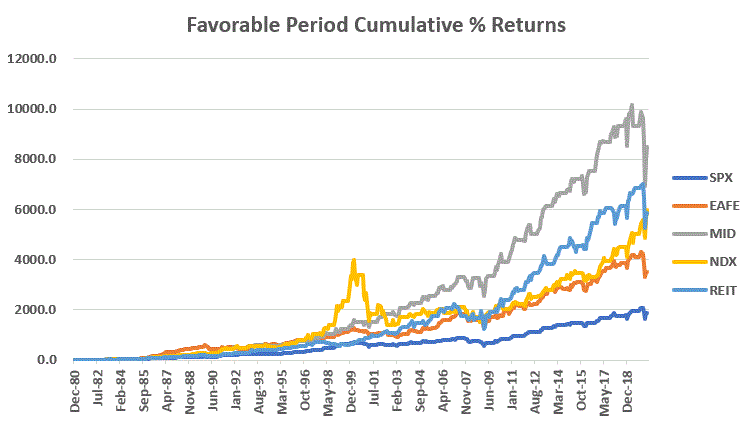
Figure 3 displays the cumulative total return for each index ONLY during the Favorable Seasonal Periods highlighted in Figure 1.

Figure 3 – Favorable Periods cumulative % return
Figure 4 displays the cumulative total return for each index ONLY during the Unfavorable Seasonal Periods – i.e., all months of the year NOT listed for a given index in Figure 1.

Figure 4 – Unfavorable Periods cumulative % return
The Key Things to Note:
*The difference in overall returns between “Favorable” and “Unfavorable” periods is stark
*There is no guarantee that any given Favorable period will show a gain, nor that it won’t show a significant loss
*In most cases it is not necessarily accurate to refer to the “Unfavorable” period as “Bearish”, since 4 of the 5 indexes show a net gain during the Unfavorable periods.
Summary
The idea of being fully bullish during a Favorable period and fully bearish during the Unfavorable period does not guarantee “smooth sailing.”
Still, the bottom line is that seasonality clearly appears to offer investors an “edge.”
Pushing one’s advantage during the Favorable periods and “picking one’s spots” during the Unfavorable periods does appear to be a good overarching theme for investors looking to “beat the market.”
See also Jay Kaeppel Interview in July 2020 issue of Technical Analysis of Stocks and Commodities magazine
See also Jay’s “A Strategy You Probably Haven’t Considered” Video
See also Video – The Long-Term…Now More Important Than Ever
Jay Kaeppel
Disclaimer: The information, opinions and ideas expressed herein are for informational and educational purposes only and are based on research conducted and presented solely by the author. The information presented represents the views of the author only and does not constitute a complete description of any investment service. In addition, nothing presented herein should be construed as investment advice, as an advertisement or offering of investment advisory services, or as an offer to sell or a solicitation to buy any security. The data presented herein were obtained from various third-party sources. While the data is believed to be reliable, no representation is made as to, and no responsibility, warranty or liability is accepted for the accuracy or completeness of such information. International investments are subject to additional risks such as currency fluctuations, political instability and the potential for illiquid markets. Past performance is no guarantee of future results. There is risk of loss in all trading. Back tested performance does not represent actual performance and should not be interpreted as an indication of such performance. Also, back tested performance results have certain inherent limitations and differs from actual performance because it is achieved with the benefit of hindsight.


April 1996? Yahoo.finance has $NDX data going back to Sept 18, 1985. And I’ve never compared the two, but my impression is that $COMPQ vs $NDX are very different indexes and don’t have enough in common to make substituting one for the other a good way to go. Just sayin’.
Jim
Hi Jim, thanks for the comment. For the record the data source that I use provides monthly total return data for many indexes and funds/ETFs. I don’t know why their database for NDX does not start until 1996. But that’s all I have. Regarding COMPQ and NDX, I agree that they are different animals however, that being said, if you run any kind of daily, weekly, monthly correlation analysis between the two the correlation always seems to come out to at least 98% or higher. So for purposes of tracking general trends and testing as far back as possible, I was OK with combining the two as I did. Take Care, Jay