Gold. Ah yes, gold. The “ultimate store of value”. Yeah, sort of, I suppose. But when it all comes down the fact remains that it may be a bit unwieldy to go to the grocery store and buy bread with a bar of gold bullion (I would have said toilet paper, but everyone knows that can’t be had even with a bar of gold these days).
It’s been said that the three most important commodities in the world are crude oil, gold and copper (although I personally think coffee and sugar should be in the discussion somewhere). But once again – and as I have stated at times in the past – when it all hits the fan, the three most important commodities in the world remain canned food, shotgun shells and cabins in the woods. But I digress.
Gold held up reasonably well in the early part of the coronavirus panic, but took a very nasty spill in the 7 trading days after topping out. What to make of it all? Should we be looking for gold to be a leading performer? Anything is possible in this uncertain time, but one analyst’s findings suggest otherwise.
The 8-Year Gold Cycle
Tom McClellan is the Editor of The McClellan Oscillator, and has long been one of my favorite analysts. In 2003 he recognized that gold tends to move in an 8-year cycle, 3 years up and then 5 years down in a “down-up-down” fashion. See McClellan’s article here. The chart of this cycle from his article appears in Figure 1.
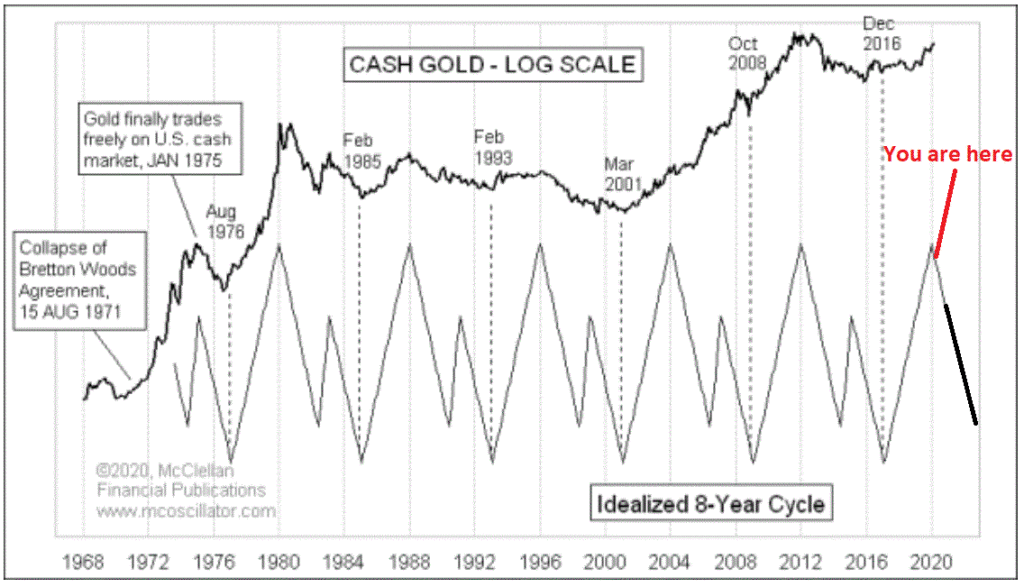
Figure 1 – McClellan’s 8-year gold cycle (Source: www.mcoscillator.com)
I don’t know for sure if Tom uses this cycle on a strict 8-year calendar basis or not. But for our purposes, that’s what we will do here. As such, starting on 12/31/1976 through 3/18/2020, we will test the following cycle:
*Phase 1 (Bullish) for 37 months (this Phase ended 1/31/2020)
*Phase 2 (Bearish) for 41 months (this Phase began 1/31/2020 and extends through 6/30/2023)
*Phase 3 (Bullish) for 8 months
*Phase 4 (Bearish) for 10 months
This totals 96 months, or 8 years. The expectation is that McClellan’s cycle – as applied here – will see gold showing gains during Phases 1 and 3 and losses during Phases 2 and 4.
How did this work out? Read on.
Results
Figure 2 displays the cumulative % return for gold during the 37-month Bullish Phase 1.
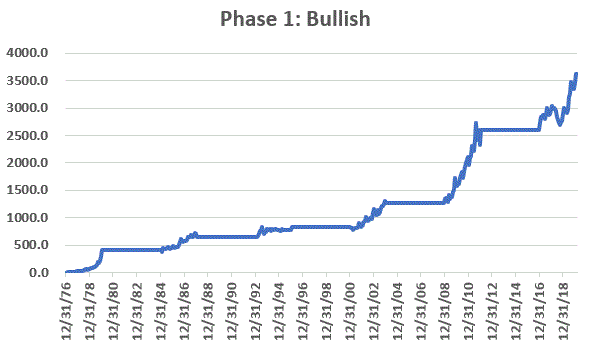
Figure 2 – Cumulative % gold return during Phase 1
The net return was +3,615%.
Figure 3 displays the cumulative % return for gold during the 41-month Bearish Phase 2.
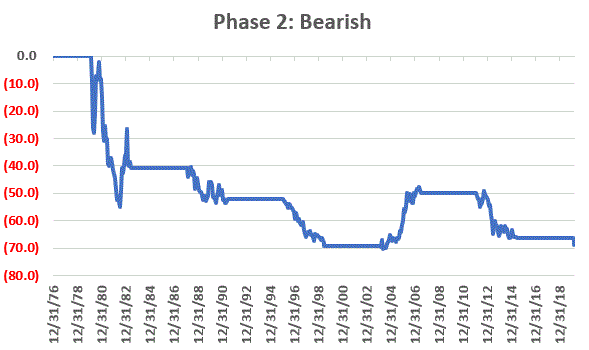
Figure 3 – Cumulative % gold return during Phase 2
The net return was -69%.
Figure 4 displays the cumulative % return for gold during the 8-month Bullish Phase 3.
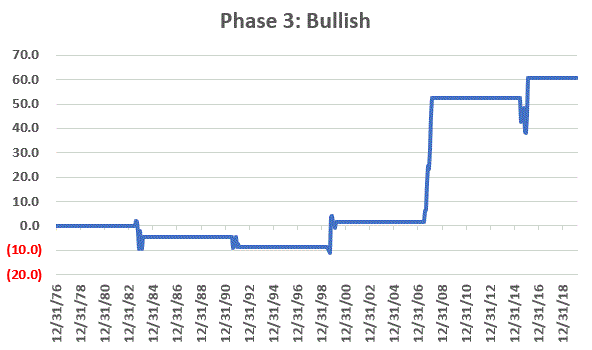
Figure 4 – Cumulative % gold return during Phase 3
The net return was +61%.
Figure 5 displays the cumulative % return for gold during the 10-month Bullish Phase 5.
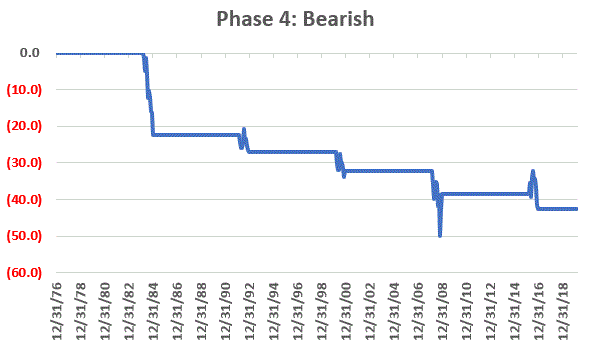
Figure 5 – Cumulative % gold return during Phase 4
The net return was -43%.
Figure 6 displays the cumulative gain/loss per Phase per cycle.
| Cycle End | Phase 1 | Phase 2 | Phase 3 | Phase 4 |
| 12/31/84 | +412.1% | (-40.6%) | (-4.7%) | (-22.4%) |
| 12/31/92 | +48.0% | (-19.3%) | (-4.3%) | (-5.9%) |
| 12/31/00 | +22.6% | (-35.5%) | +11.6% | (-7.0%) |
| 12/31/08 | +47.3% | +61.6% | +49.8% | (-9.3%) |
| 12/31/16 | +96.8% | (-32.7%) | +5.3% | (-6.7%) |
| 12/31/24 | +37.9% | (-7.5%*) | ||
| Cumulative | +3,615.4% | (-68.9%) | +60.7% | (-42.5%) |
Figure 6 – Gold returns during McClellan 8-year gold cycle Phases
*as of 3/20/20
Combining Bullish Phases
Figure 7 displays the cumulative return for gold during Phase 1 months AND Phase 3 months. The cumulative gain was +5,869%

Figure 7 – Gold cumulative % return Phase 1 and 3
Combining Bearish Phases
Figure 8 displays the cumulative return for gold during Phase 2 months AND Phase 4 month. The cumulative loss (through 3/18/20) was -82%

Figure 8 – Gold cumulative % return Phase 2 and 4
The Latest
The latest Bullish Phase 1 extended from 12/31/16 through 1/31/20 during which time gold gained +37.9%
The current Bearish Phase 2 began on 1/31/20 and will extend through 6/30/2023. Through 3/18/20 gold has lost -7.5% during this latest Phase 2. As you can see in Figure 6, Phase 2 has showed a loss during 4 of the previous 5 completed Phases. Hence the reason the title of this article suggests that investors not expect a great deal from gold. That being said, the one “Up” Phase 2 period saw gold rally +61.6%, so anything is possible.
Summary
In light of the coronavirus panic a lot of people are looking for alternative investments in order to get away from the carnage taking place in the stock market. Because of its reputation as a “store of value in times of trouble”, a lot of people are looking at gold. The history of McClellan’s 8-year gold cycle suggests that that might be a mistake.
On the flip side, the one thing you always have to keep in mind about seasonal/cyclical trends is that there is no way to know if they will work as expected “this time around.”
In sum, I am NOT pounding the table telling you to avoid gold completely. I am merely pointing out that history suggests that gold may not be your “savior” as some people seem to expect.
But forgetting all that, the bottom line is that McClellan’s 8-year gold cycle has done a darn good job of keeping an investor on the right side of the gold market.
Thanks Tom.
Jay Kaeppel
Disclaimer: The information, opinions and ideas expressed herein are for informational and educational purposes only and are based on research conducted and presented solely by the author. The information presented does not represent the views of the author only and does not constitute a complete description of any investment service. In addition, nothing presented herein should be construed as investment advice, as an advertisement or offering of investment advisory services, or as an offer to sell or a solicitation to buy any security. The data presented herein were obtained from various third-party sources. While the data is believed to be reliable, no representation is made as to, and no responsibility, warranty or liability is accepted for the accuracy or completeness of such information. International investments are subject to additional risks such as currency fluctuations, political instability and the potential for illiquid markets. Past performance is no guarantee of future results. There is risk of loss in all trading. Back tested performance does not represent actual performance and should not be interpreted as an indication of such performance. Also, back tested performance results have certain inherent limitations and differs from actual performance because it is achieved with the benefit of hindsight.

