For the record, “tutorial” may not actually be the right word. The word “tutorial” implies that “this is how you do something.” In reality, when it comes to trading options, there is no “one way” to do anything. So, think of what follows as more of an “example of one way to play” and NOT as the “only or best way.”
For Openers: Catalyst and Expectation
We will walk through an example that buys a call option on ticker CGC. For openers, when looking to buy a call option on anything you will ideally have two “thoughts” in place:
*A “catalyst”
*An “expectation”
A “catalyst” is simply something (anything) that prompts you to want to take a trade in the given underlying security in the first place. Be it overbought/ oversold, trend-following, Elliott Wave, reversion to the mean, an indicator crossover, an indicator/price divergence, etc., (the potential list is essentially infinite). But the point is, you need something that says to you, OK, now’s the time.”
An “expectation” involves any thoughts you might have regarding how far you expect the underlying security to move and any timeframe you might have in mind. For example, if you expect the underlying security to “rally 2% in the next 5 days” that is a different proposition than saying “well I expect it to trend higher in the months ahead”.
Month and Strike Selection
The next step is to select the option that offers the preferred tradeoff between reward and risk given your particular “expectation”.
In the first instance, you can buy the shorter-term option that offers the maximum return if the underlying does indeed rally 2% in 5 days. In the second instance, you would likely need to buy a much longer-term option and will need to consider carefully which strike to buy (to mitigate time decay, etc.)
Trade Management
Once a trade has been identified and entered the trade needs to be managed (for the record, the trade management plan should already be figured out before you actually enter the trade). This basically involves setting parameters on:
When you will take a profit: If your expectation is that the underlying security will rise 2% in 5 days and it rises 2% in 5 days you should (presumably) just go ahead and take the profit.
When (and if) you will cut a loss: A long call (or put) can lose no more than the premium paid, so depending on how you size your trades it may not be necessary to cut an open loss. However, in many cases, if a trade is not working (ex., the underlying security is not moving as expected) out it makes sense to have some plan to conserve some capital by exiting rather than just sitting around waiting for the option to lose 100% of its premium.
When you might consider adjusting the trade (typically to improve the overall reward-to-risk profile): If you buy 10 calls and get a nice profit it can make a lot of sense to sell some of those calls to lock in some profit and then “let the remaining position ride” in hopes of the “Big Score”.
Example
We will look at ticker CGC. Figure 1 displays a bar chart from ProfitSource by HUBB with a Bullish Wave 4. The target range is $56.86 to $63.50 by August 28th.
(click to enlarge any of the Figures below)
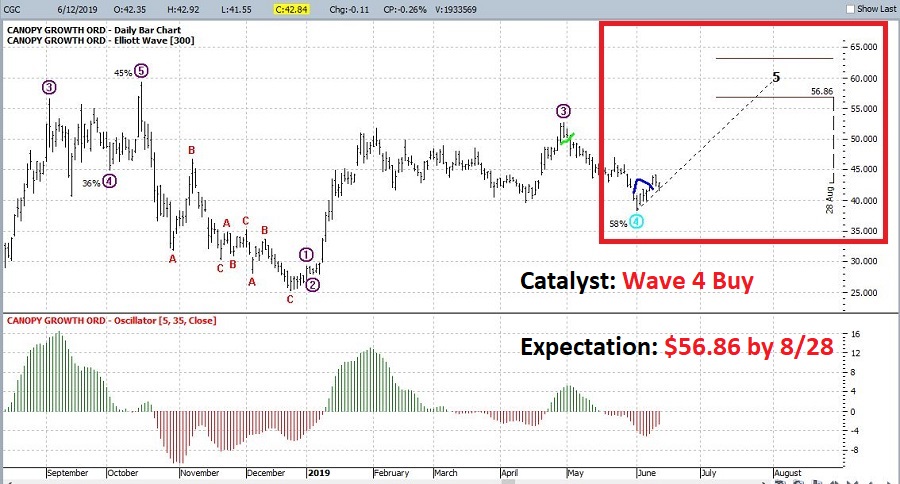 Figure 1 – CGC with Elliott Wave count (Courtesy ProfitSource by HUBB)
IMPORTANT: There is NO GUARANTEE that any “wave count” is going to pan out as projected. As such, please note that while I do use and heartily endorse ProfitSource, I am not suggesting that this signal (or any other signal) generated will lead to a profit and of course – as always – I AM NOT “recommending” the example trade that follows. All of this is presented merely as an “example” of “one way” to play.
Figure 2 shows that implied volatility for CGC options is on the low end of the historical range. This suggests that options are “cheap” and may be conducive to buying call options. CAVEAT: CGC has only been around for a short time so the historical IV range could certainly expand (higher or lower) in the future.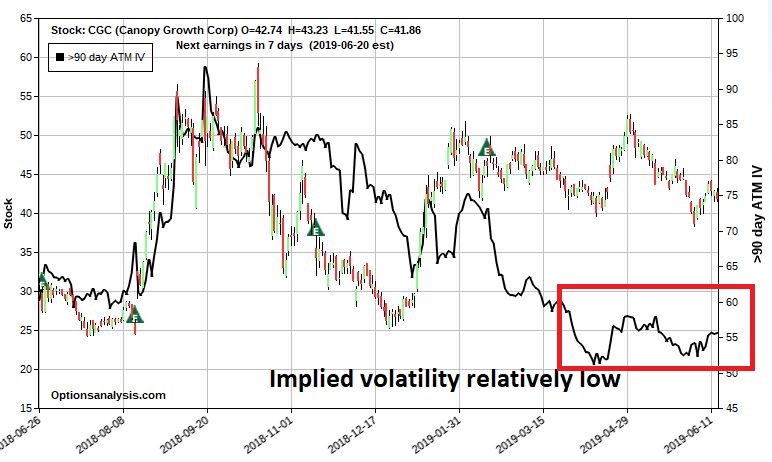 Figure 2 – Implied volatility on CGC options is “low” (Courtesy www.OptionsAnalysis.com)
Figure 3 displays an input screen from www.OptionsAnalysis.com. In this example we are looking for the call option with “Highest Probability of Touching it’s % to Double Price” (i.e., how far does the underlying stock have to move in price in order for the option to double in price AND what is the mathematical probability of the stock hitting that price).
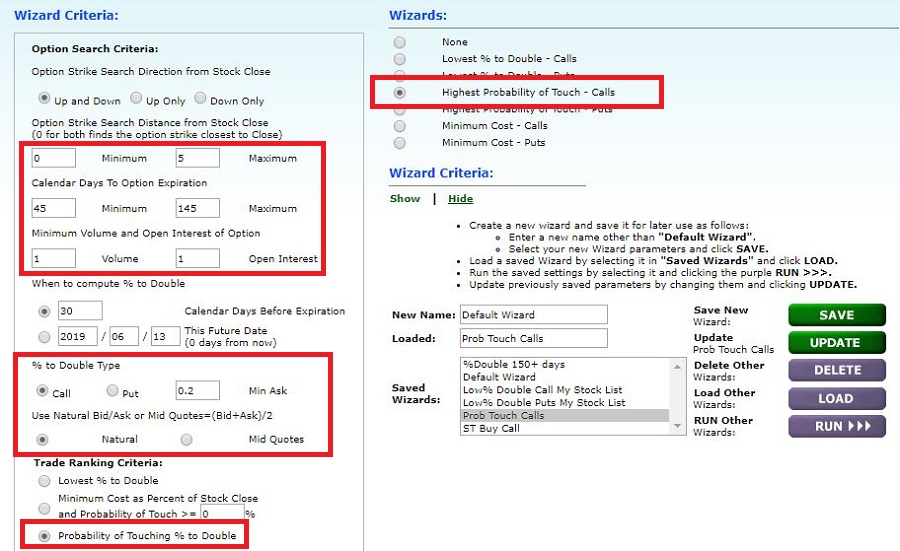 Figure 3 – Looking for Highest Probability of Touch % to Double price at www.OptionsAnalysis.com (Courtesy www.OptionsAnalysis.com)
Figure 4 displays the output screen and lists the October 42.5 call as the top choice. The next to last column tells us that the stock must rise +23.76% by 30 days prior to option expiration in order for this option to double in price. The far right column tells is that there is a 36.56% chance of this happening.
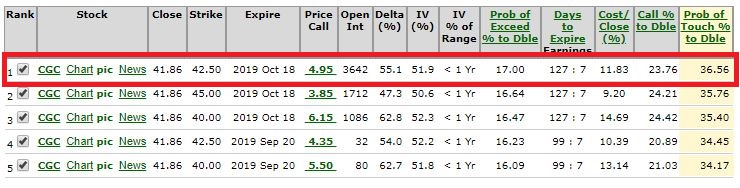 Figure 4 – Probability of Touch % to Double Output (Courtesy www.OptionsAnalysis.com)
Figure 5 displays the particulars for this trade. Note that the entry price is $4.75. If we place a market order we would presumably get filled at the “ask” price of $4.95. So, this example assumes that we used a “limit order” to buy at the midpoint of the bid/ask spread. Traders need to remember that a “market” order guarantees a fill, but likely at the highest possible price. A “limit” order can allow you to buy the option at a lower price, however, there is no guarantee that you will be filled at your price (or at all). Just one more decision a trader must make.
One tip: If a trader absolutely wants to enter a trade, one possibility is to place a limit order to try to get filled at a better price, and if not filled near the end of the day to cancel the limit order and (bite the bullet) and buy via a market order (in order to avoid missing the trade altogether).
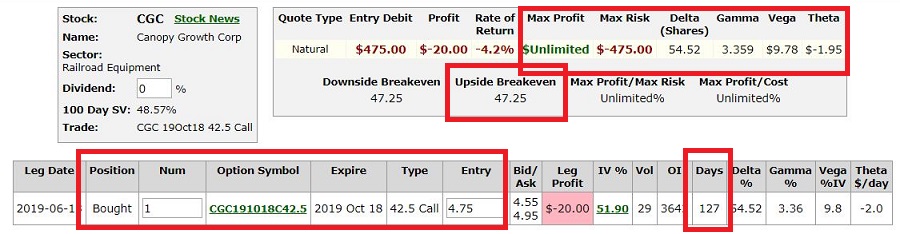 Figure 5 – CGC trade particulars (Courtesy www.OptionsAnalysis.com)
Figure 6 displays the risk curves through October expiration (the black line represents the expected P/L at the time of October expiration). The most obvious thing is the “unlimited profit potential/limited risk” nature of the trade.
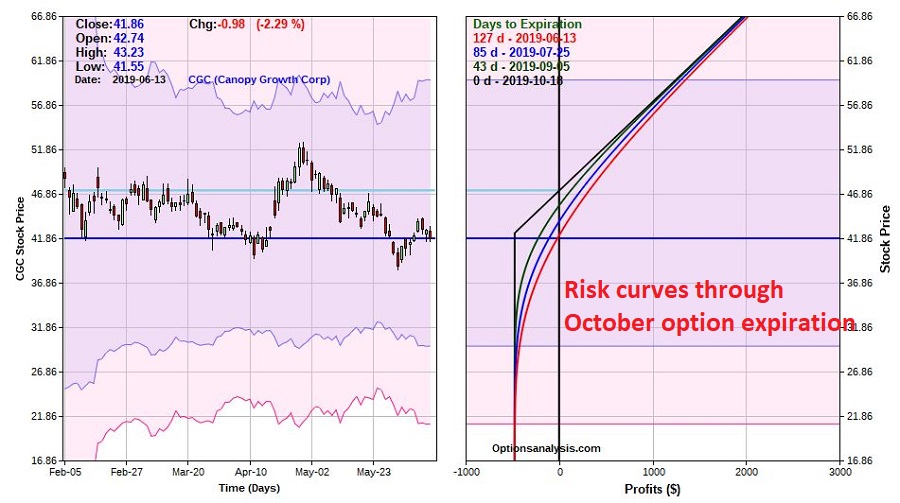 Figure 6 – CGC call option risk curves (Courtesy www.OptionsAnalysis.com)
A mentor of mine – a gentleman named Mitch Genser – was fond of pointing out the importance of looking more closely at “where this trade lives.” Let’s consider that concept here.
On the downside, the reality is that if CGC drops to say $35 or below the likelihood of things working out profitably are quite low. So, we might consider using that as an arbitrary “bail out” point.
On the upside, the Elliott Wave count in ProfitSource showed $56.86 a share as a target. The count also suggested the move if it is going to happen – should happen by August 28th. So, Figure 7 shows us “where this trade lives”, i.e., between $35 a share and $56.86 a share through August 28th.
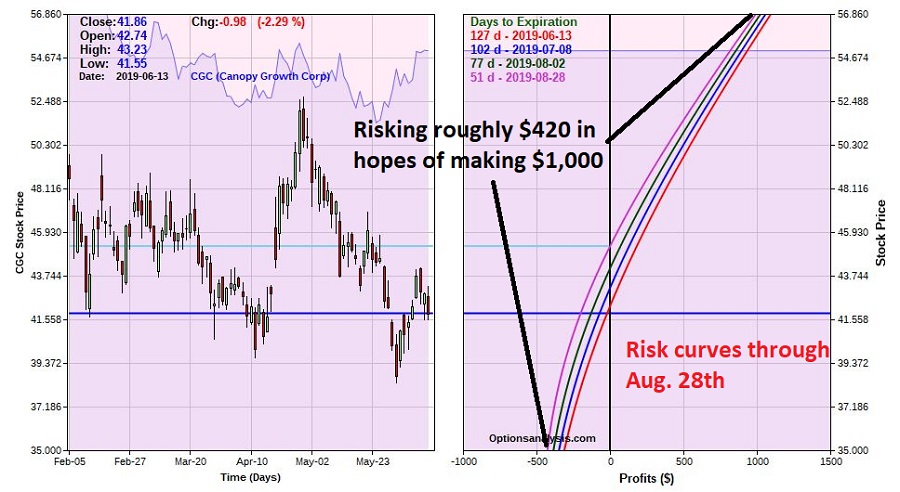 Figure 7 – CGC call option risk curves through August 28th (Courtesy www.OptionsAnalysis.com)
When analyzed this way, this example trade basically comes down to giving CGC roughly 2 ½ months to move higher to $56.86 – which would generate a profit in the $1,000 range – or to drop down to $35 a share – which would result in a loss in the -$420 range.
Summary
The purpose of this article is NOT to suggest that you trade options on CGC nor is it intended to suggest that you should rely solely on Elliott Wave projections to target trades. The purpose is simply to highlight one example of a set of steps that may help traders improve their odds on a trade-by-trade basis:
*A trading catalyst
*An expectation regarding the underlying security
*Identifying the option that offers the best tradeoff between reward and risk based on one’s “expectations”
*Deciding how to enter a trade (market versus limit)
*A plan to manage the trade once entered (i.e., when to take a profit, cut a loss, and/or adjust the initial position)
*The emotional wherewithal to follow the plan
In the immortal words of Sean Connery as Malone in the Untouchables, “Here ends the lesson.”
Jay Kaeppel
Disclaimer: The data presented herein were obtained from various third-party sources. While I believe the data to be reliable, no representation is made as to, and no responsibility, warranty or liability is accepted for the accuracy or completeness of such information. The information, opinions and ideas expressed herein are for informational and educational purposes only and do not constitute and should not be construed as investment advice, an advertisement or offering of investment advisory services, or an offer to sell or a solicitation to buy any security.

