Is there seasonality in the bond market? How about we look at the numbers and you decide for yourself? You know, some good old, “We report, you decide” type of journalism versus the more widely prevalent “We decide, then we report (our slanted view)” style of reporting that tends to dominate all news these days.
Jay’s Bond Market Calendar
The calendar reads like this:
*December through April = High-yield corporate bonds
*May through August = Long-term treasuries
*September through November = Intermediate-term treasuries
Vehicles:
*For high yield corporate we use ticker VWEHX (Vanguard High-Yield Corporate) from January 1979 through March 2019 (ETF alternatives are HYG and JNK)
*For long-term treasuries we use the Bloomberg Barclays Treasury Long-Term Index from January 1979 through May 1986 and then ticker VUSTX (Vanguard Long-Term Treasury) from June 1986 through March 2019 (ETF alternative: ticker TLT)
For intermediate-term treasuries we use the Bloomberg Barclays Treasury Intermediate Index from January 1979 through October 1991 and ticker VFITX (Vanguard Intermediate-term Treasury) from November 1991 through March 2019 (ETF alternative: ticker IEI)
As a Benchmark we use the Vanguard Aggregate Bond Index from January 1979 through September 2003 and ticker AGG (iShares Barclays Aggregate Bond Fund) from October 2003 through January 2019 (ETF alternative: ticker AGG)
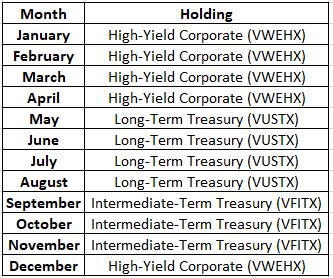
Figure 1 – Jay’s Bond Market Calendar
The Results
Figure 2 displays the cumulative growth of $1,000 using our switching calendar.
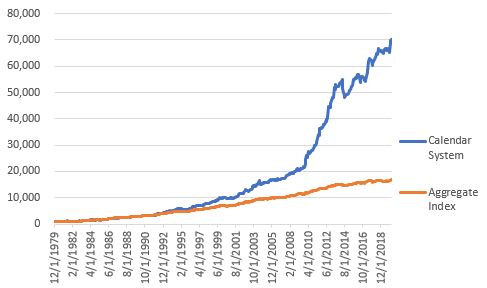
Figure 2 – Growth of $1,000 invested using the Calendar versus buying and holding an Aggregate bond index; 12/31/1978-3/31/2019
Figure 3 displays some relevant facts and figures
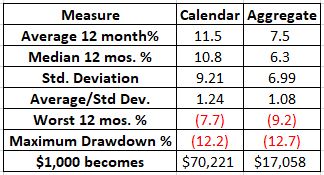
Figure 3 – Comparative Results
Some things to note:
*The System appears to show a huge edge over time. Yet it should be pointed out that all the “edge” occurred after February 1990. Figure 4 displays the System equity divided by the Benchmark equity.
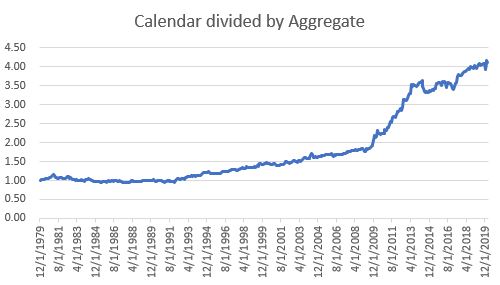
Figure 4 – Calendar approach equity divided by Aggregate bond index equity
Note that from January 1979 through February 1990 the System was mostly in line with buying and holding the aggregate index. Since then the relative returns have been sharply higher.
*Long-term bonds are a question mark going forward if and when we enter a truly “rising rate environment”.
Summary
So, is our “Bond Calendar” a viable approach to bond investing? Should bond investors prepare to sell high-yield bonds at the end of April and switch to long-term treasuries?
None of that is for me to say. Here is what we can say for sure: From January 1979 through February 1990, this Calendar-based approach performed in line with an aggregate bond index and from March 1990 through March 2019 this Calendar-based approach outperformed an aggregate bond index by a factor of 5.1-to-1 (+2,150% for the Calendar versus +423% for the aggregate bond index).
Does any of this mean anything?
We’ve reported. You decide.
Jay Kaeppel
Disclaimer: The data presented herein were obtained from various third-party sources. While I believe the data to be reliable, no representation is made as to, and no responsibility, warranty or liability is accepted for the accuracy or completeness of such information. The information, opinions and ideas expressed herein are for informational and educational purposes only and do not constitute and should not be construed as investment advice, an advertisement or offering of investment advisory services, or an offer to sell or a solicitation to buy any security.

