Everybody likes to talk about buying and selling and what their trading and so on and so forth. But when you boil it all down all that really matters are the following three values:
*% of winning trades
*Average gain in $
*Average loss in $
You can make money with a low % of winning trades if your average winner far exceeds your average loser. Likewise you can make money with a small average $ gain if you have a high percentage of winning trades. What all of this means is that in the end it all comes down to reward versus risk and this means understanding just exactly what you are getting into with any trade.
Example: TSLA
I use www.OptionsAnalysis.com for a variety of functions. One function is referred to as Darknet Signals, which generates buy signals for stocks and ETFs based on an algorithm developed by a gentleman named John Broussard (one of the smartest people I have met in this business). I’ll not get into specifics here as I am using a signal simply to set up an example. As you can see in Figure 1, Darknet generated a buy signal for TSLA on 2/25.
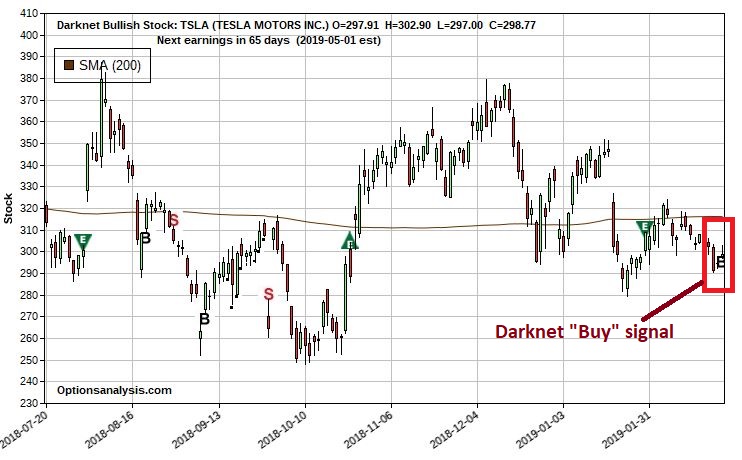 Figure 1 – TSLA with Darknet Signals (Courtesy www.OptionsAnalysis.com)
To illustrate the concept of understanding reward vs risk let’s look at four potential bullish trades for TSLA as of the close on 2/25.
Trade #1: Buy 100 Shares of TSLA stocks
This position requires an investor to put of $29,877 to buy 100 shares of TSLA stock. Each point that TSLA rises or falls will equate to a $100 gain or loss for the position. Details and risk curves appear in Figure 2.
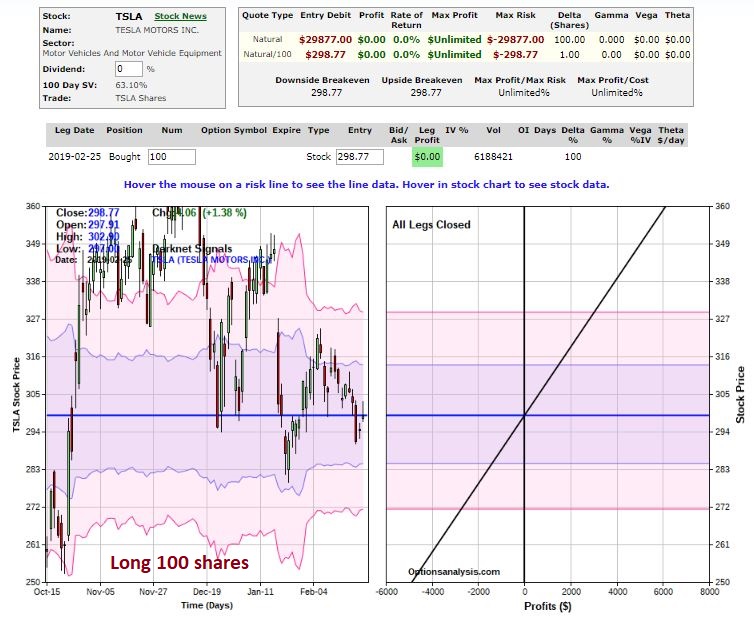 Figure 2 – Details and risk curves for Buy 100 shares (Courtesy www.OptionsAnalysis.com)
Trade #2: Buy/Write (Buy 100 Shares of TSLA stock, sell one call option)
For example’s sake this position buys 100 shares of TSLA at $298.77 a share and sells an Apr2019 305 call option for $17.75. This trade costs $28,102 to enter. Details appear in Figure 3.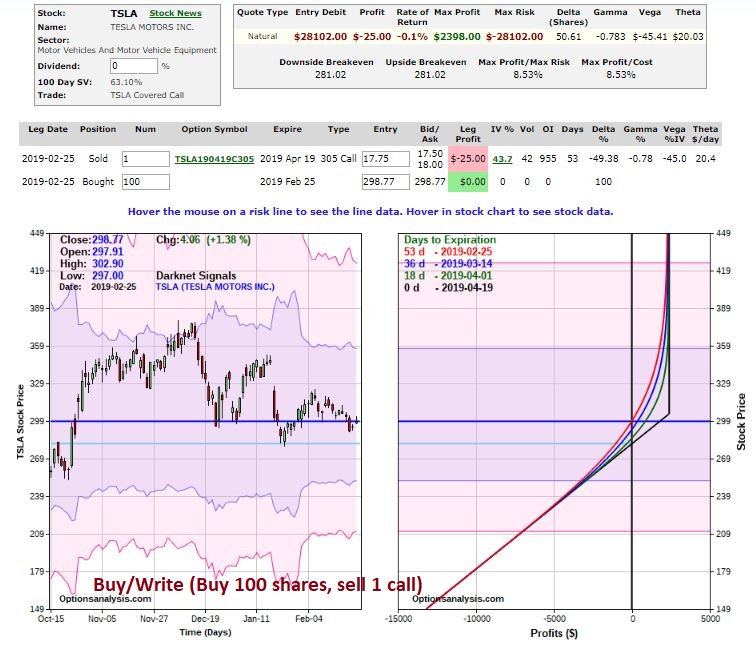 Figure 3 – Details and risk curves for Buy/Write 100 shares, sell 1 305 call (Courtesy www.OptionsAnalysis.com)
Trade #3: Buy 100 Shares of TSLA stocks
This position buys 1 Apr 315 call option at a cost of $1,335. Details and risk curves appear in Figure 4.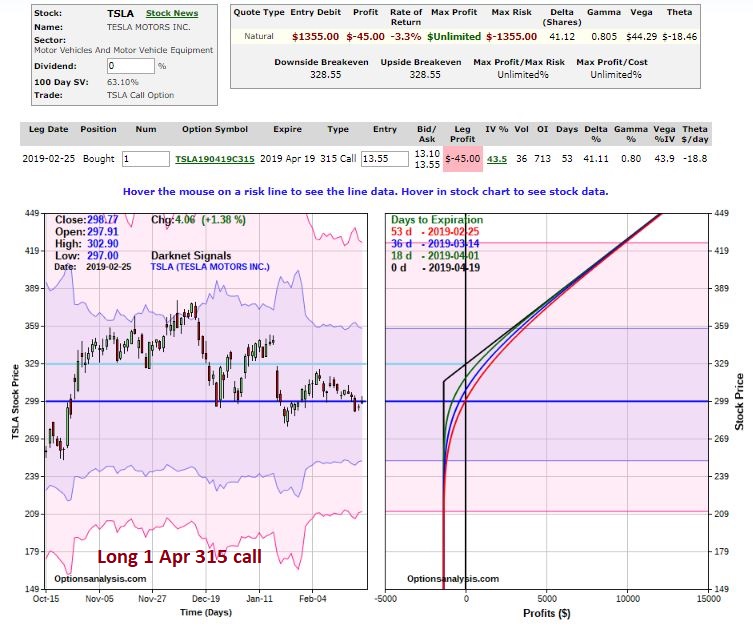 Figure 4 – Details and risk curves for Buy 100 shares (Courtesy www.OptionsAnalysis.com)
The Tradeoffs
Figure 5 displays the $ gain or loss for each trade based on a given price for TSLA shares as of April option expiration.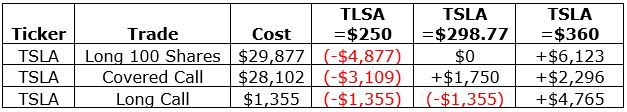 Figure 5 – Dollar gain(loss) based on TSLA share price at April option expiration (Courtesy www.OptionsAnalysis.com)
Figure 6 displays the % gain or loss for each trade based on a given price for TSLA shares as of April option expiration.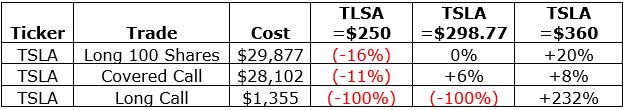 Figure 6 – % gain(loss) based on TSLA share price at April option expiration (Courtesy www.OptionsAnalysis.com)
On the positive side:
*The long stock position offers point-for-point movement
*The covered call affords $17.75 a share ($1,775) of downside protection
*The long call requires roughly 95% less capital ($1,355 vs. $28,000+) to enter
On the negative side:
*The long stock and covered call positions require a lot of capital
*The long call has a breakeven price of $328.55 (current stock price $288.77)
So in a nutshell, it comes down to:
*How confident you are that TSLA will rally between now and mid-April
*How much capital you have (and are willing) to commit
Note in Figures 5 and 6 what happens if TSLA remains unchanged:
*The stock position has no gain or loss
*The covered call has a gain of +6%
*The long call suffers a 100% loss of the $1,335 premium (on the other hand if TSLA tanks this is the maximum loss the long call position can incur)
Summary
So which is the “best” trade. But now you understand the relative potential rewards and risk for several different positions.
The ability to assess and compare competing opportunities and to choose the position that fits your objectives and temperament (and account size) best, is one of the most useful abilities you can develop.
Jay Kaeppel
Disclaimer: The data presented herein were obtained from various third-party sources. While I believe the data to be reliable, no representation is made as to, and no responsibility, warranty or liability is accepted for the accuracy or completeness of such information. The information, opinions and ideas expressed herein are for informational and educational purposes only and do not constitute and should not be construed as investment advice, an advertisement or offering of investment advisory services,

