As a person who has crunched a lot of numbers I concur that there is something appealing about dividing one financial market related number by another financial market related number and then analyzing the fluctuations over time in hopes of proclaiming that “it means something!” (Note to myself: work on those run-on sentences).
But sometimes simple can be pretty useful. Consider the following
Strategy:
*Hold High Income vehicle November through May
*Hold Intermediate-term treasuries during June through October
Benchmark:
*Buy and Hold High Income vehicle AND intermediate-term treasuries (rebalancing once a year)
Vehicles:
*FAGIX – Fidelity Capital and Income
*FGOVX – Fidelity Government Income
Test Period:
*Oct 31st, 1979 through January 31st, 2019
Strategy:
*Buy FAGIX on 10/31 each year; switch to FGOVX on 5/31 each year
That’s it – buy FAGIX on October 31st each year, then sell it on May 31st of the following year and switch to FGOVX.
Figure 1 displays the growth of $1,000 starting in 1979 using “the strategy” versus buying-and-holding both funds (with an annual rebalance to 50/50)
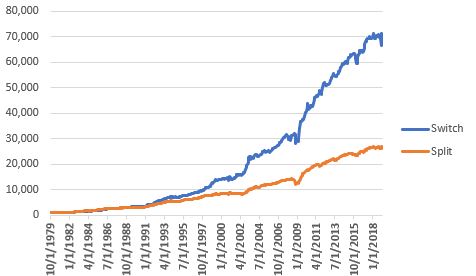
Figure 1 – Growth of $1,000; Strategy (Switch) versus Buy-and-Hold (Split); 0% fees
Figure 2 displays some relevant facts and figures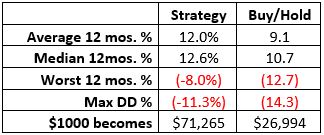
Figure 2 – Results; 10/31/1979-1/31/2019
A Few Things to Note
The “System” has had:
*An average annual return of 12%
*A worst 12 months of -8%
*A maximum drawdown of -11.3%
This might qualify as reasonably “low risk” for a lot of investors.
Still, please remember that I am not “recommending” this strategy, only highlighting it as an example of one that does not involve any “rocket science.
In addition, remember that the “big question” is “what happens in a full-blown bond bear market?”. FAGIX has about an 80% correlation to the S&P 500 and a slightly inverse correlation to 3-7 year treasuries notes. FGOVX has a roughly 86% correlation to 3-7 year treasury notes and a slightly negative correlation to the S&P 500 Index.
In addition, intermediate-term treasuries (which is what FGOVX holds) tend to perrom much better than longer-term bonds when rates are rising.
So there is a chance that the strategy holds up well. But we won’t know for sure until the time actually comes. Please note that since 10-yr yields bottomed in 2011, the median annual return for the “System” is +6.3% (versus 5.8% for buy-and-hold).
Figure 3 displays the annual results
| Year | Strategy | Buy/Hold |
| 1980 | (1.0) | 5.5 |
| 1981 | 10.8 | 8.8 |
| 1982 | 26.8 | 30.9 |
| 1983 | 14.0 | 12.3 |
| 1984 | 6.7 | 10.9 |
| 1985 | 25.0 | 21.6 |
| 1986 | 19.3 | 16.3 |
| 1987 | 8.5 | 1.2 |
| 1988 | 11.8 | 9.5 |
| 1989 | 8.1 | 4.7 |
| 1990 | 4.5 | 2.8 |
| 1991 | 25.1 | 22.9 |
| 1992 | 29.6 | 18.0 |
| 1993 | 23.2 | 18.6 |
| 1994 | (4.0) | (4.9) |
| 1995 | 14.7 | 17.4 |
| 1996 | 12.7 | 6.7 |
| 1997 | 12.9 | 11.8 |
| 1998 | 23.7 | 6.7 |
| 1999 | 14.1 | 5.5 |
| 2000 | (1.9) | 1.6 |
| 2001 | 14.6 | 1.0 |
| 2002 | 17.7 | 5.3 |
| 2003 | 24.6 | 20.7 |
| 2004 | 7.2 | 8.1 |
| 2005 | 1.5 | 3.7 |
| 2006 | 11.9 | 8.3 |
| 2007 | 8.4 | 5.8 |
| 2008 | (6.1) | (10.4) |
| 2009 | 39.7 | 36.7 |
| 2010 | 8.6 | 11.1 |
| 2011 | 9.4 | 3.0 |
| 2012 | 9.6 | 9.5 |
| 2013 | 7.0 | 3.6 |
| 2014 | 5.8 | 5.8 |
| 2015 | 3.0 | (0.2) |
| 2016 | 6.3 | 5.9 |
| 2017 | 6.9 | 6.9 |
| 2018 | (4.5) | (2.6) |
Figure 3 – Year-by-Year Results; 1980-2018
Summary
So is the “System” detailed herein of value? That’s not for me to say. But the real point is – it has done reasonably well – and it sure is simple. And that is the main point – just because some approach to investing is “complex” or “complicated” doesn’t mean it’s better.
Jay Kaeppel
Disclaimer: The data presented herein were obtained from various third-party sources. While I believe the data to be reliable, no representation is made as to, and no responsibility, warranty or liability is accepted for the accuracy or completeness of such information. The information, opinions and ideas expressed herein are for informational and educational purposes only and do not constitute and should not be construed as investment advice, an advertisement or offering of investment advisory services, or an offer to sell or a solicitation to buy any security.

