Consistency matters – a lot – when it comes to investing. We all want to make as much as we can but at the end of the day Will Rogers famous quote (“I’m more interested in the return of my money than I am the return on my money”) still rings true for a lot of investors. Which leads us to…
Jay’s Trading Maxim #4: The volatility of the fluctuations of the equity in your account will have a greater impact on your success or failure as a trader than any other factor.
In “chicken and egg” terms, the more things keep “moving in the right direction” the more likely an investor is to “follow the plan” and the more likely things are to keep “moving in the right direction.”
A Persistently Consistent Trend
Many investors are familiar with the phrase “Sell in May and Go Away”. The phrase is based on the tendency of the U.S. stock market to perform better during the months of November through May than through the months of June through October. Of course, as with any trend there is a lot of variability along the way. While it is correct to refer to the November through May period as “the bullish months”, it is not necessarily accurate to call June through October “the bearish months”. June through October is more like the “Sometimes good for years at a time, sometimes very, extremely bad and long-term in sum mostly a whole lot of nothing months” (which doesn’t roll of the tongue quite like “Sell in May”).
Some of the most significant bearish declines (1973, 1974, 1987, 2000-2002, 2008) have experienced their worst between June and October. At the same time, 6 of the past 7 years and 8 of the last 10 have seen stocks show a gain during the so-called “unfavorable” months.
But let’s forget about all of that for a moment and go back to the importance of persistent consistency. The bottom line is this: For most investors,
*The more consistently a strategy shows a gain
*The more likely the investor will stick with the strategy, and;
*The more likely they will be successful over the long-term
Consistency in the Broader U.S. Stock Market
For our purposes we will use The Wilshire 5000 Total Market Index to measure results. The Wilshire 5000 is widely accepted as the definitive benchmark for the U.S. equity market, and measures performance of all U.S. equity securities with readily available price data. We will use monthly total return data form the PEP database from Callan Associates.
Figure 1 displays the growth of $1,000 invested in WILSHIRE starting October 1972 and held through October 2018.
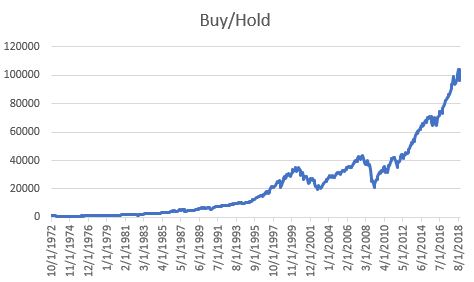
Figure 1 – Growth of $1,000 invested in WILSHIRE using buy-and-hold; Oct-1972 through Oct-2018
As you can see in Figure 1, there was significant growth of capital over time. However, there was also a much volatility along the way, including two separate drawdowns in excess of -30% and another in excess of -23%.
Figure 2 displays the growth of $1,000 invested in WILSHIRE ONLY during the months of November through May every year versus June through October every starting in 1972 through October 2018.
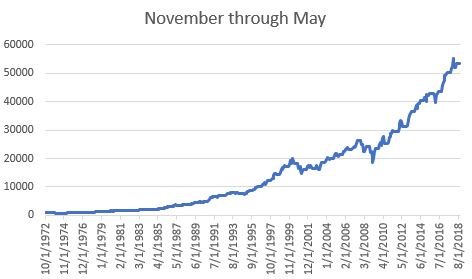
Figure 2 – Growth of $1,000 invested in WILSHIRE during November 1st through May 31st each year; Oct-72 through Oct-18
Figure 3 displays the growth of $1,000 invested in WILSHIRE ONLY during the months of June through October every year versus June through October every starting in 1973 through October 2018.
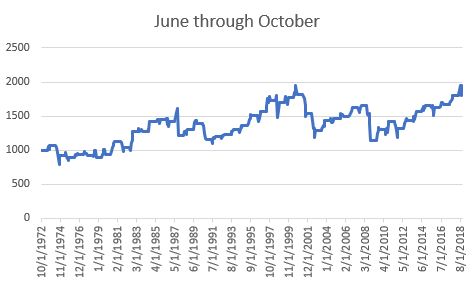
Figure 3 – Growth of $1,000 invested in WILSHIRE during June 1st through October 31st each year; Oct-72 through Oct-18
In Figures 2 and 3, note the relatively smooth and consistent growth of capital during the Nov-May period and the much more volatile and less consistent returns during the Jun-Oct period.
The Results
Figure 4 displays a wealth of comparative performance information for WILSHIRE performance during the “favorable” months of November through May versus performance during the “unfavorable” months of June through October.
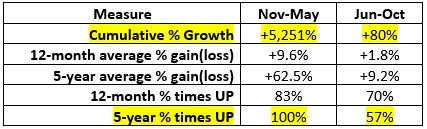
Figure 4 – WILSHIRE performance
Here is the key thing to note:
*Looking at performance during the Power Zone months over any 5-year period has witnessed a positive return for the Wilshire 5000 Index 100% of the time.
To put it another way, if an investor had followed a strategy of holding a broad index of U.S. stocks during November-May every year for any 5 year period since 1972, they would have showed a gain at the end of the 5 year (one can also assume that additional interest would have been earned by holding cash or bonds or whatever during June through October)
Does this mean that all 5-year periods in the future will also witness positive results. Absolutely not. As the saying goes, “past performance is no guarantee of future results”. That being said, the rhetorical question for today is “How many (simple, 100% objective) strategies can you name that showed positive rolling 5-year returns 100% of the time over the past 46 years?”
If nothing else, it is an interesting question/
Jay Kaeppel
Disclaimer: The data presented herein were obtained from various third-party sources. While I believe the data to be reliable, no representation is made as to, and no responsibility, warranty or liability is accepted for the accuracy or completeness of such information. The information, opinions and ideas expressed herein are for informational and educational purposes only and do not constitute and should not be construed as investment advice, an advertisement or offering of investment advisory services, or an offer to sell or a solicitation to buy any security.


What etf matches the performance of the Wilshire 5000?
Paul, best bet (in my opinion) is ticker VTI. VTI actually tracks the CRSP U.S. Total Stock Market Index, however the correlation in monthly total returns for VTI versus the Wilshire 5000 Index is 99.99%. There is a mutual fund (WFIVX) that tracks the Wilshire 500 specifically. However, expense ratio is 0.62% versus 0.04% for VTI – which makes a significant difference over time. Jay