What the title of this article attempts to say (in its own tortured way) is that this article details a “portfolio” that has made money during the month of January in 36 of the 40 previous years, i.e., 90% of the time. It does not imply that you will make a return of 90% on your investment. Also – and here comes the part I hate – just because “something” has been 90% correct in the past does NOT imply that there is a 90% probability that it will make money this time around. I view every investment or trading proposition as a 50/50 deal.
Still, the history is compelling, so please consider the evidence.
The 90% January Portfolio
The “portfolio” is really just a combination of two securities – a municipal bond ETF or fund and a high-yield corporate bond ETF or fund – with each getting a 50% allocation.
For historical testing purposes I used:
VWITX – Vanguard Intermediate-Term Municipal Bond
VWEHX – Vanguard High Yield Corporate
Unfortunately, due to switching restrictions buying and holding these funds for one month is problematic. So for trading purposes I look to:
MUB – iShares National Muni Bond ETF
JNK – SPDR Bloomberg Barclays High Yield Bd ETF
OR
HYG – iShares iBoxx $ High Yield Corp Bd ETF
Figure 1 displays the cumulative % growth of equity holding the 2 Vanguard funds ONLY during the month of January every year starting in 1979.
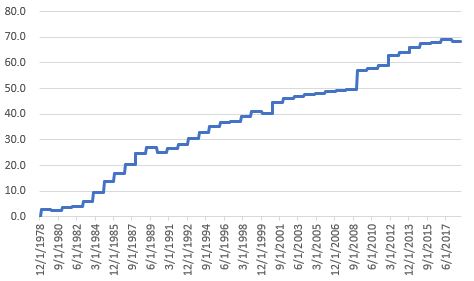
Figure 1 – Cumulative growth achieved by holding VWITX and VWEHX ONLY during January; 1979-2018
Figure 2 displays several relevant performance numbers.
| January | Result |
| # times UP | 36 (90%) |
| # times DOWN | 4 (10%) |
| Average UP% | +1.55% |
| Average DOWN % | (-0.75%) |
| Largest UP | +4.72% |
| Largest DOWN | (-1.30%) |
Figure 2 – VWITX and VWEHX in January; 1979-2018
Figure 3 displays the year-by-year January results for VWITX and VWEHX.
| Year | VWITX | VWEHX | Average |
| Jan-79 | 2.59 | 3.30 | 2.95 |
| Jan-80 | (0.78) | (0.47) | (0.62) |
| Jan-81 | 1.89 | 0.52 | 1.21 |
| Jan-82 | 1.74 | (0.80) | 0.47 |
| Jan-83 | 0.58 | 3.56 | 2.07 |
| Jan-84 | 3.76 | 2.41 | 3.09 |
| Jan-85 | 4.53 | 3.54 | 4.04 |
| Jan-86 | 4.19 | 0.85 | 2.52 |
| Jan-87 | 2.76 | 3.66 | 3.21 |
| Jan-88 | 3.59 | 3.55 | 3.57 |
| Jan-89 | 1.76 | 1.62 | 1.69 |
| Jan-90 | (0.50) | (2.10) | (1.30) |
| Jan-91 | 1.54 | 0.65 | 1.09 |
| Jan-92 | 0.02 | 2.41 | 1.22 |
| Jan-93 | 1.16 | 2.81 | 1.99 |
| Jan-94 | 0.93 | 2.20 | 1.57 |
| Jan-95 | 2.17 | 1.36 | 1.77 |
| Jan-96 | 1.02 | 1.24 | 1.13 |
| Jan-97 | 0.21 | 0.75 | 0.48 |
| Jan-98 | 0.79 | 1.86 | 1.32 |
| Jan-99 | 1.23 | 1.59 | 1.41 |
| Jan-00 | (0.51) | (0.77) | (0.64) |
| Jan-01 | 1.32 | 4.82 | 3.07 |
| Jan-02 | 1.53 | 0.75 | 1.14 |
| Jan-03 | (0.59) | 1.56 | 0.48 |
| Jan-04 | 0.27 | 0.93 | 0.60 |
| Jan-05 | 0.57 | (0.17) | 0.20 |
| Jan-06 | 0.28 | 0.92 | 0.60 |
| Jan-07 | (0.24) | 0.60 | 0.18 |
| Jan-08 | 1.63 | (0.72) | 0.45 |
| Jan-09 | 3.73 | 5.71 | 4.72 |
| Jan-10 | 0.54 | 0.83 | 0.69 |
| Jan-11 | (0.66) | 2.01 | 0.67 |
| Jan-12 | 2.20 | 2.87 | 2.54 |
| Jan-13 | 0.39 | 0.67 | 0.53 |
| Jan-14 | 1.67 | 0.66 | 1.17 |
| Jan-15 | 1.51 | 0.64 | 1.07 |
| Jan-16 | 1.29 | (0.99) | 0.15 |
| Jan-17 | 0.53 | 1.00 | 0.76 |
| Jan-18 | (1.04) | 0.21 | (0.42) |
Figure 3 – Yearly Results
Again, for trading purposes ETFs such as MUB and JNK (or HYG) are more viable.
Summary
So, is the “dynamic duo” of MUB and JNK (or HYG) going to generate a gain during January 2019? Unfortunately, only time will tell. And even if it does, as you can see in Figure 2, we are not talking about “riches beyond the dreams of avarice” here. But the main point is that anything that has been 90% correct over four decades is at least worthy of some contemplation.
Jay Kaeppel
Disclaimer: The data presented herein were obtained from various third-party sources. While I believe the data to be reliable, no representation is made as to, and no responsibility, warranty or liability is accepted for the accuracy or completeness of such information. The information, opinions and ideas expressed herein are for informational and educational purposes only and do not constitute and should not be construed as investment advice, an advertisement or offering of investment advisory services, or an offer to sell or a solicitation to buy any security.

