Trading successfully over an extended period of time is not easy. Period. It takes investment capital that can be risked, a money management plan, a method for deciding when to enter a trade, criteria for when to exit with a profit, criteria when to exit with a loss and the emotional and financial wherewithal to do all of the above over and over again without letting fear and/or greed insinuate themselves in any of the above.
No, it’s not easy. Then again sometimes it’s not that hard.
Here is one such scenario:
*A security makes a low
*It then rallies over some period of time
*Then price eventually works its way back down to that original low
*Maybe it doesn’t quite touch the original low, or maybe it touches the original low and then bounces, or maybe it breaks down briefly through the original low and then reverses back to the upside
*At the same time, any number of other technical indicators are making a higher low than they did at the time of original low in price, thereby setting up what we “technical analyst types” refer (glowingly) to as a “bullish divergence”.
*Oh, and if everybody hates the underlying security in question, and has pretty much given up on it and thrown in the towel-even better.
Of course not every routine “bullish divergence” pans out as a good trading opportunity. But if you pay close enough attention, every once in awhile the market “lobs one in.”
Consider long-term treasury bonds.
Long-Term Treasury Bonds
There is great fear and loathing regarding long-term bonds these days. And not without good reason. As I highlighted in Figure 3 of this article, chances are good that we are in the relatively early stages of a long-term advance in interest rates. If this scenario does pan out there is a lot of pain in store for holders of long-term treasuries.
But every dog has its day. Or week. Or month. Or Whatever.
Figures 1 below shows a weekly chart of ticker TLT – an ETF that tracks the 20+ year Treasury bond. As you can see, it’s been an awful performer in recent years. In addition, a lot of people have gotten the memo that interest rates are likely in a new long-term rising trend and long-term bonds have become one of the least loved investments.
(click to enlarge)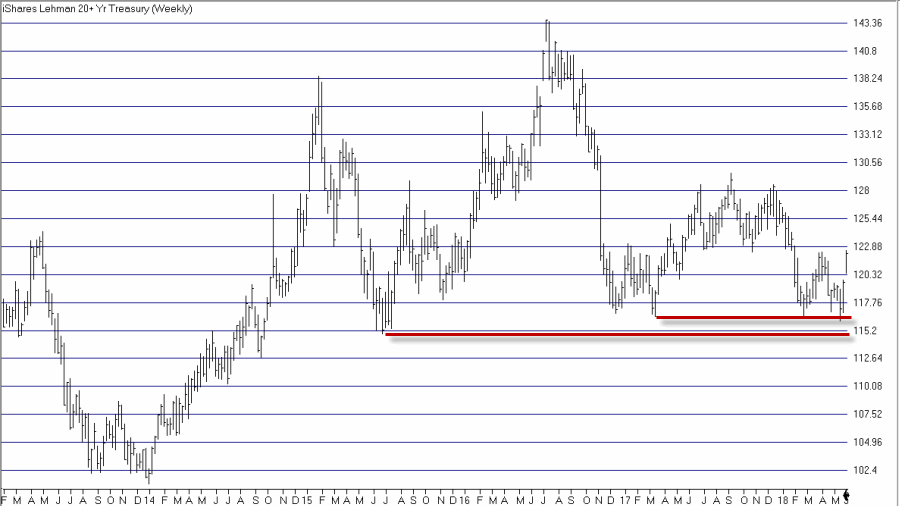 Figure 1 – Ticker TLT Weekly successfully tests support
Still, funny how things work sometimes. On 5/17, TLT broke down through the upper support line drawn in Figure 1. On the very next day, it reversed and closed back above that support line. At the same time a host of indictors generated bullish divergences. See Figures 2 through 5.
(click to enlarge)
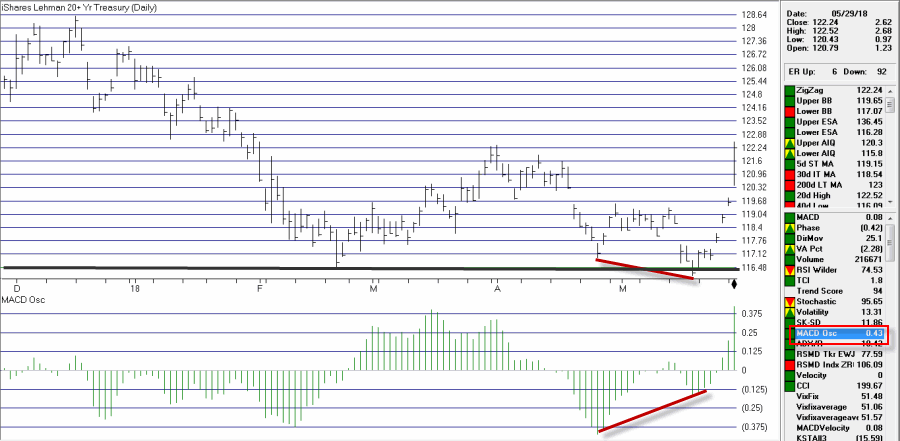 Figure 2 – TLT support reversal with MACD Oscillator bullish divergence (Courtesy AIQ TradingExpert)
(click to enlarge)
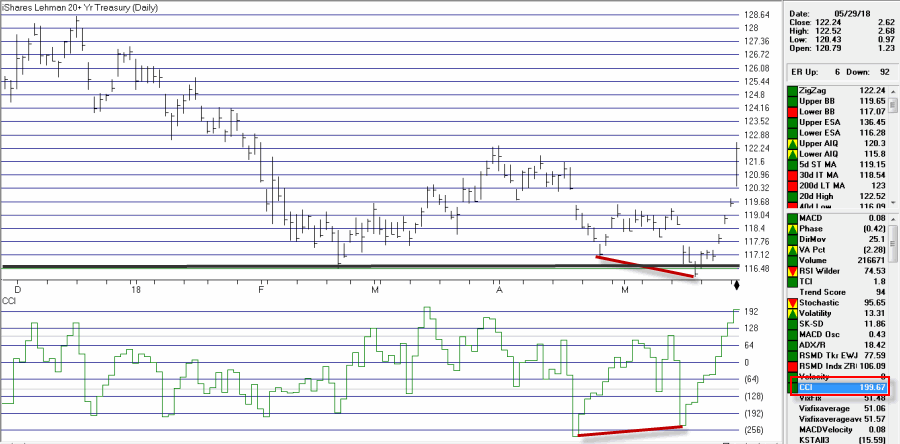 Figure 3 – TLT support reversal with Commodity Channel Index (CCI) bullish divergence (Courtesy AIQ TradingExpert)
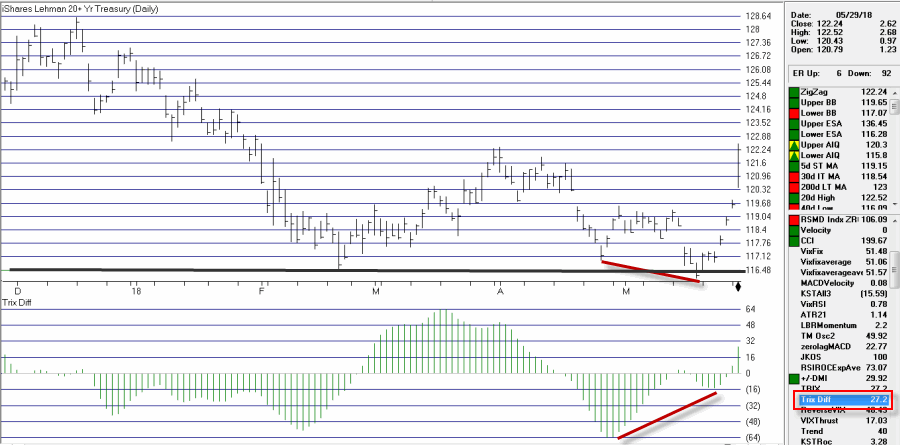 Figure 4 – TLT support reversal with TRIX Differential bullish divergence (Courtesy AIQ TradingExpert)
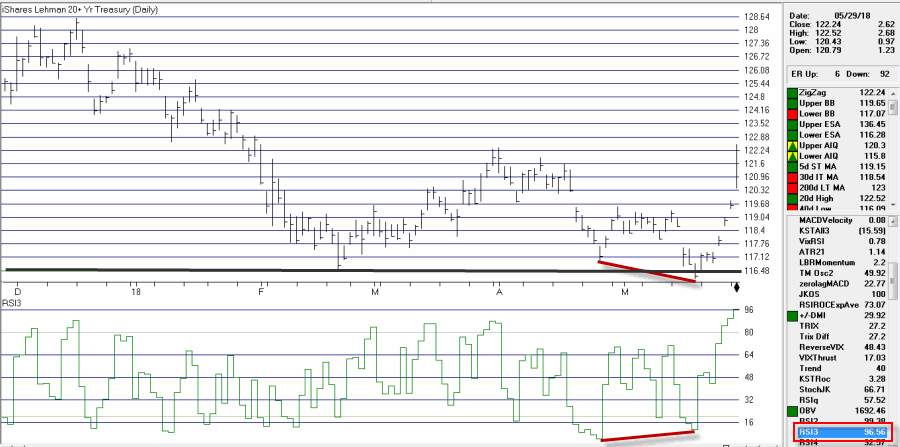 Figure 5 – TLT support reversal with 3-day RSI bullish divergence (Courtesy AIQ TradingExpert)
So here is the relevant question – Is it that hard to recognize this as a bullish trading opportunity?
The answer is: “Yes, if you had convinced yourself that bonds are in a long-term bear market and that all hope was lost” (as a majority of investors had done). On the other hand, if you looked at this setup objectively it was clearly not that hard to recognize.
Now, did all of this imply that “the coast is clear” and that the long term fundamentals for bonds had changed at that it was time to load upon long-term treasury bonds? Not at all.
From a trading perspective, however, instead of loading up on actual treasury bonds, or funds or ETFs consider the trader who bought a slightly out-of-the-money September 118 call for $223. As you can see in Figure 6, six trading days later this option was up +129%.
(click to enlarge)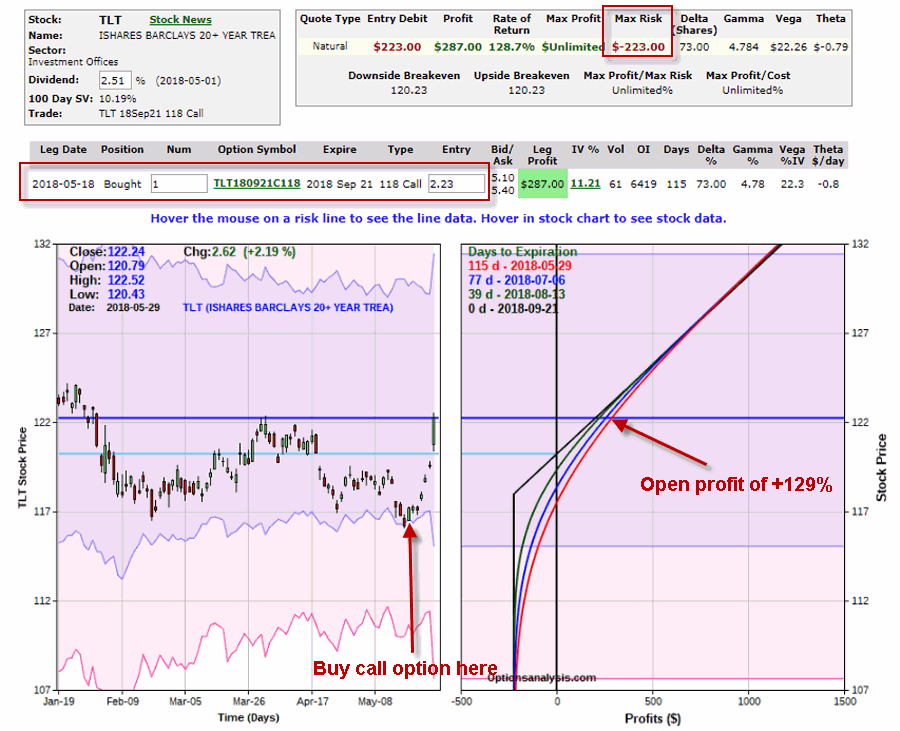 Figure 6 – Risk curves for TLT Sep2018 118 strike price call (Courtesy www.OptionsAnalysis.com)
Summary
Fear and greed are universal. Once something goes too far in one direction, investors often “tune out” that security and assume it can only be traded in the “agreed upon” direction (i.e., in this case bonds had/have nowhere to go but down). And in so doing they close their eyes to potential opportunities, which often are hiding in plain sight.
While I am a huge advocate of “trend following”, it is important to remember that shorter-term trading opportunities are everywhere. And as we just saw with the case of bonds:
*Opportunities often occur where you least expect them
*The setup is often fairly obvious (if one is open to seeing it)
*The difficulty in taking advantage of said opportunities lies mostly between our own ears.
Jay Kaeppel
Disclaimer: The data presented herein were obtained from various third-party sources. While I believe the data to be reliable, no representation is made as to, and no responsibility, warranty or liability is accepted for the accuracy or completeness of such information. The information, opinions and ideas expressed herein are for informational and educational purposes only and do not constitute and should not be construed as investment advice, an advertisement or offering of investment advisory services, or an offer to sell or a solicitation to buy any security.

