Please attend the free on-line seminar that I will be teaching on Wednesday, November 20th.
Info link: http://tinyurl.com/nys8rqj
To attend live webinar for no cost visit: http://go.mta.org/lobby112013 on 11/20 before Noon EST
One of the long time debates among market analysts is arguing the relative merits of “growth” stocks versus “value” stocks. Some argue that earnings growth is the name of the game when it comes to great stocks. Others argue that it is best to buy them when they are “giving ‘em away.” So who’s right and who’s wrong? It beats the heck out of me. In fact, my own analysis suggests that there is a “time for value” and a “time for growth.” Nevertheless, this article will detail a system I’ve developed that only trades vgrowth stocks – “when the time is right.”
The Benchmarks
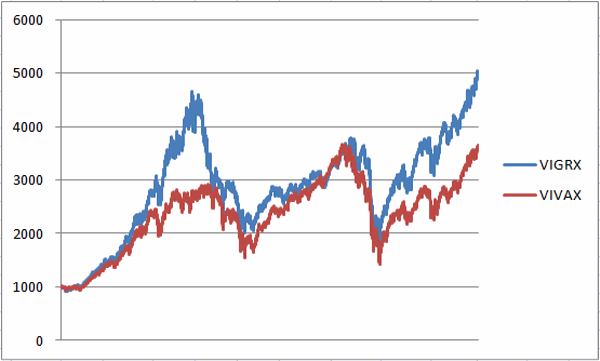
Figure 1 displays the growth of $1,000 invested in Vanguard Growth Fund (VIGRX) and $1,000 invested in Vanguard Value Fund (VIVAX) since January 1994. Some will look at Figure 1 and state that growth stocks are “better” than value stocks because they have generated a greater profit. But as you can see, through the 2008 decline they were basically even. Since that time growth has vastly outperformed value. But history suggests their performance will converge once again somewhere down the road.
 Figure 1 – $1,000 invested in Growth stocks (blue line; ticker VIGRX) versus $1,000 invested in Vale stocks (red line; ticker VIVAX) since January 1994
As it turns out it is possible to build a model that invests only in value stocks, yet outperforms both of these indexes by moving to cash on occasion (roughly 15% of the time). So here goes:
Jay’s “Show Me the Growth” Model (SMTG)
To those who dislike math all I can say is “just grit your teeth and you can get through this”. Here are the calculations:
A = Daily close for VIGRX divided by daily close for VIVAX
B = 39-day exponential moving average of A
C = ((A – B) / B) * 100
D = C – 1.2
(That wasn’t so painful, right?)
“Show Me the Value” Trading Rules
-If yesterday’s value for D < 0 then buy Growth stocks at the close today (or continue to hold value stocks if already long).
-If yesterday’s value for D > 0 then sell Value stocks at the close today (or remain in cash if already in cash).
That’s all there is to it.
Now, let’s try it in English and then look at the results.
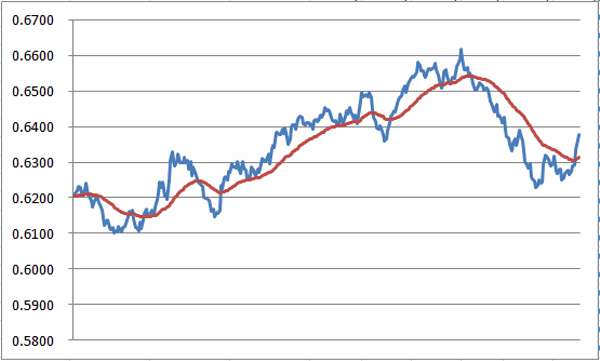
Figure 2 displays the daily values for variables A and B above. The blue line is Value A and is derived by dividing growth stock fund (VIGRX) price divided by value stock fund (VIVAX) price.
The red line is Value B or the 39-day exponential moving average of Value A and is arrived at by multiplying yesterday’s value for B times 0.95 and today’s value for A by 0.05 and adding the two together. When the blue line is above the red it indicates that growth stocks are outperforming value stocks. Figure 2 – VIGRX divided by VIVAX (blue line) and 39-day exponential moving average (red line); August 2012-Present
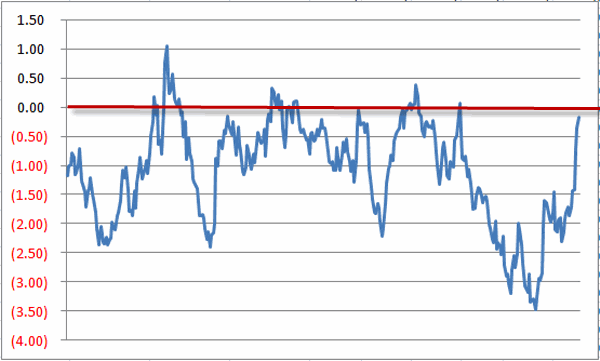
Figure 3 displays value C which is the difference between the two lines shown in Figure A as a percentage (again, A-B and then that value is divided by B and then multiplied by 100. Are we having fun yet?) minus 1.2. Figure 3 – “Show Me The Value” Signal Line (Below 0=Long Value Stocks; Above 0=Cash) ; August 2012-Present
As long as the Value D shown in Figure 3 is negative we want to hold growth stocks. When that value moves to positive territory we move to cash until Value D drops back below 0.
System Results
OK, so what the heck do all these gyrations do for us? Well, they give a us a pretty decent model for making money in the stock market and does so with lower degree of volatility than experienced using a buy and hold approach.
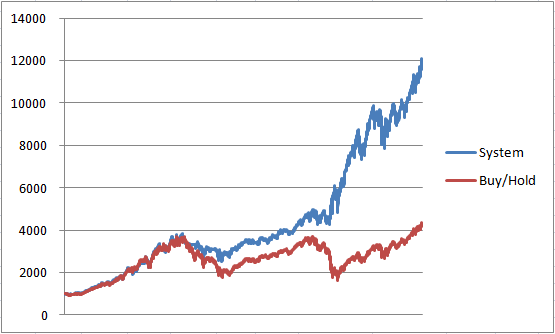
To make a comparison we will compare the growth of $1,000 invested using the system versus the growth of $1,000 split equaling between VIGRX and VIVAX on a buy and hold basis. While the system is in cash we will assume a nominal rate of interest of 1% per year. 
Figure 4 – Growth of $1,000 using SMTV System(blue line) versus Buy and Hold (red line) (1994-present)
| Measure | SMTV System | Buy and Hold |
| Growth of $1,000 | $12,001 (+1,101%) | $4,3146 (+331%) |
| Average Annual % +(-) | +14.2% | +9.4% |
| Std. Deviation of Annual %+(-) | 15.1 | 19.3 |
| Average Return/Std. Dev. | 0.94 | 0.49 |
| # Years Up/Down | 16/4 | 15/5 |
| Worst Year | -10.5% (2000) | (-35.7%) 2008 |
| Worst Peak-to-Trough Decline | (-33.8%) | (-55.9%) |
| % of time spent in Value Stocks | 85% | 50% |
| % of Time spent in Growth Stocks | 0 | 50% |
| % of time spent in cash | 15% | 0% |
Figure 5 – Performance Comparison
Figure 6 after the article shows the annual results
In a nutshell, the system has:
-Outperformed a buy-and-hold approach (+14.2% annually and +1,101% in all versus +9.4% annually and +331% in all)
-And has done so with less volatility (annual standard deviation of 15.1% for the system versus 18.4% for buy-and-hold)
-And less risk (maximum drawdown of 33.8% versus -55.9% and a worst calendar year of -10.5% versus -30.9%).
Summary
So should everyone abandon their current investment model and adopt this one? Should investors completely abandon growth stocks and invest only in values stocks as this system does? And will this system outperform buy and hold ad infinitum into the future.
The answer to each of these questions is “probably not.” Still, in the end we are talking about an objective, mechanical system that averages 14% a year, outperforms buy and hold and does so with less volatility.
As a proud graduate of “The School of Whatever Works”, all I can say is “I’ve seen worse.”
Jay Kaeppel
| Year | System | Buy/Hold | Diff |
| 1994 | 3.2 | (0.5) | 3.7 |
| 1995 | 35.5 | 37.2 | (1.7) |
| 1996 | 19.4 | 23.3 | (3.9) |
| 1997 | 28.1 | 33.1 | (5.0) |
| 1998 | 38.9 | 29.2 | 9.7 |
| 1999 | 24.4 | 22.0 | 2.4 |
| 2000 | (10.5) | (11.3) | 0.8 |
| 2001 | (4.1) | (14.1) | 10.0 |
| 2002 | (7.7) | (21.0) | 13.3 |
| 2003 | 17.9 | 22.7 | (4.8) |
| 2004 | 3.8 | 5.3 | (1.5) |
| 2005 | 11.1 | 9.9 | 1.2 |
| 2006 | 8.6 | 9.8 | (1.2) |
| 2007 | 6.4 | 1.0 | 5.4 |
| 2008 | 29.7 | (35.7) | 65.4 |
| 2009 | 33.1 | 27.8 | 5.3 |
| 2010 | 18.2 | 12.5 | 5.6 |
| 2011 | (7.2) | 0.2 | (7.4) |
| 2012 | 10.5 | 10.1 | 0.5 |
| 2013 | 24.9 | 26.5 | (1.5) |
| Average | 14.2 | 9.4 | |
| StdDev | 15.1 | 19.3 | |
| Ave/SD | 0.938 | 0.486 |


Jay, one of the worries that I have with systems posted as above, is with over optimisation. Why a 39 exponential MA? Why 1.2 in the formula D=C-1.2? etc.. If you vary the settings is there a gentle degradation in results or a sudden drop off? I know that I can test this myself but I am interested in understanding your test approach. –thanks Ryan
Ryan,
Concerns about over optimization for any mechanical system are always valid. That being said, in this case the 39-period MA was a “default” choice rather than an optimized one (the 39-period MA was first popularized back in the early 1980’s by Dick Fabian – for the record he used a simple 39-week MA to trade mutual funds).
Also, this particular model is something I use across a number of different “pairs”. The 1.2 value is used across all of those pairs.
In other words, the 39 and 1.2 values used were not optimized for this one particular system. Whether that is a good thing or not is open for debate.
Take care
Jay
As always, another interesting concept. My concern is with the year 2008 as an outlier. Without it, the outcomes of the two approaches would be much closer, although the SMTV would still be the winner. Not sure if another 2008 phenom would appear again, and no one of course knows. But for my tastes, I’d look for a simpler system to trade that would perform better without the outliers.